
APRIL 2020 – HOW’S THE MARKET?
I hope you are doing well…it’s a crazy world out there, so I hope all is well with you and your family!
In the video above, I do a quick overview of the March 2020 real estate numbers, as well as share some stats from the first couple weeks of April. The March numbers are not truly reflective of the impact the COVID-19 situation is having in our local real estate market, as many of the sales reported in the March statistics were initiated before all of the Government measures took affect.
Our April statistics will tell a much clearer picture of this, which I will discuss in more detail in next month’s update…but, spoiler alert, it’s pretty dramatic!
I also share my thoughts on the key factors that will likely determine how the rest of our year goes, and what could happen to our housing prices – take a look.
MARKET OVERVIEW
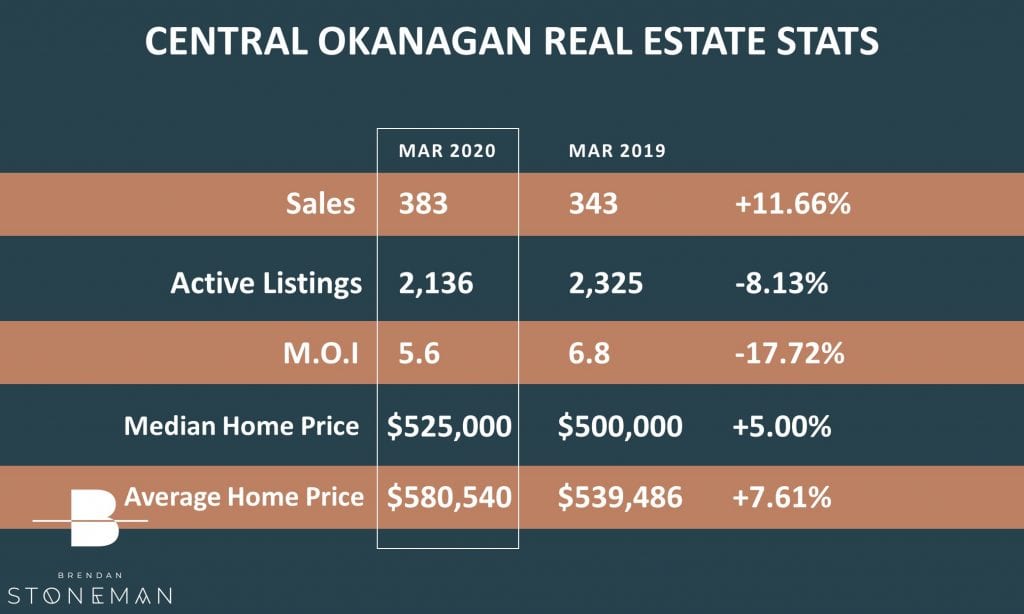
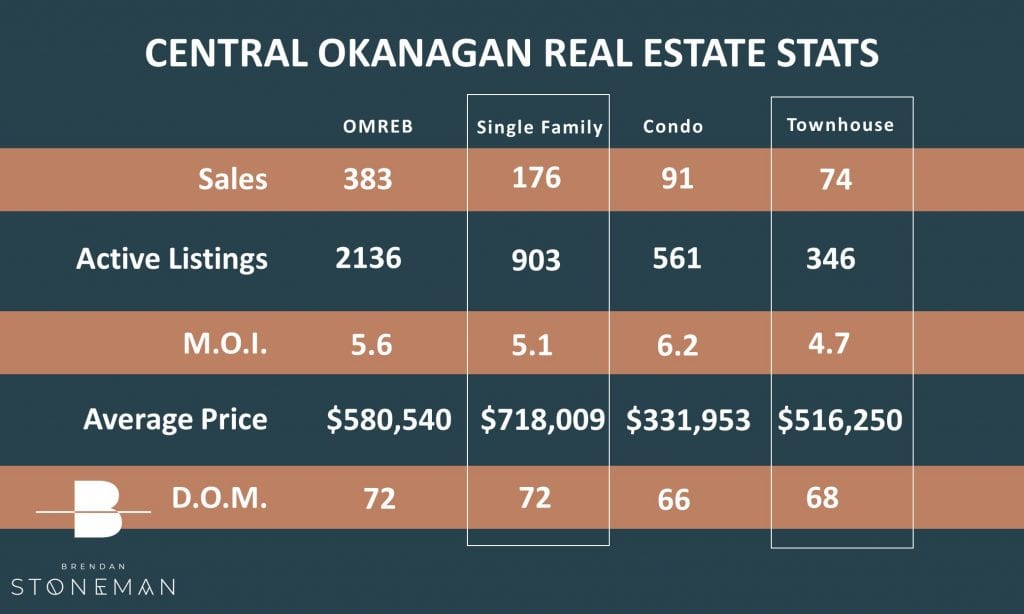
In March 2020, we saw an 11.66% increase in residential property sales over the previous year, and our total listing inventory dropped by 8% to 2,136 total listings. When the dust settled at the end of March, the market over all was nicely sitting in a balanced market.
We also saw our overall average price jump 7.61% to $580,540 (all residential property categories combined)
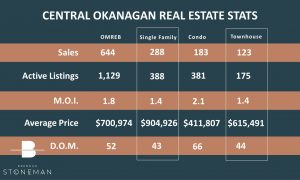
The table below shows the breakdown on where the 383 total monthly sales came from, and shows the total inventory levels for each property category!
On average, it is taking right around 70 days to sell a home, plus or minus a couple days depending on the property type, and the market in March was very active, all things considered.
That was then, this is now. The COVID-19 pandemic has everyone staying home…which is naturally having a big impact on our real estate market. Many buyers have been temporarily laid off work, or have had their businesses shut making mortgage qualification challenging for some, and impossible for others.
We are all looking forward to coming out the other side of this, and our lives returning to some kind of normal. There is talk of some of the measures in place being loosened up in the coming weeks…which, assuming people can return to their jobs, will likely give our market a sizable boost too!
SINGLE FAMILY HOME UPDATE
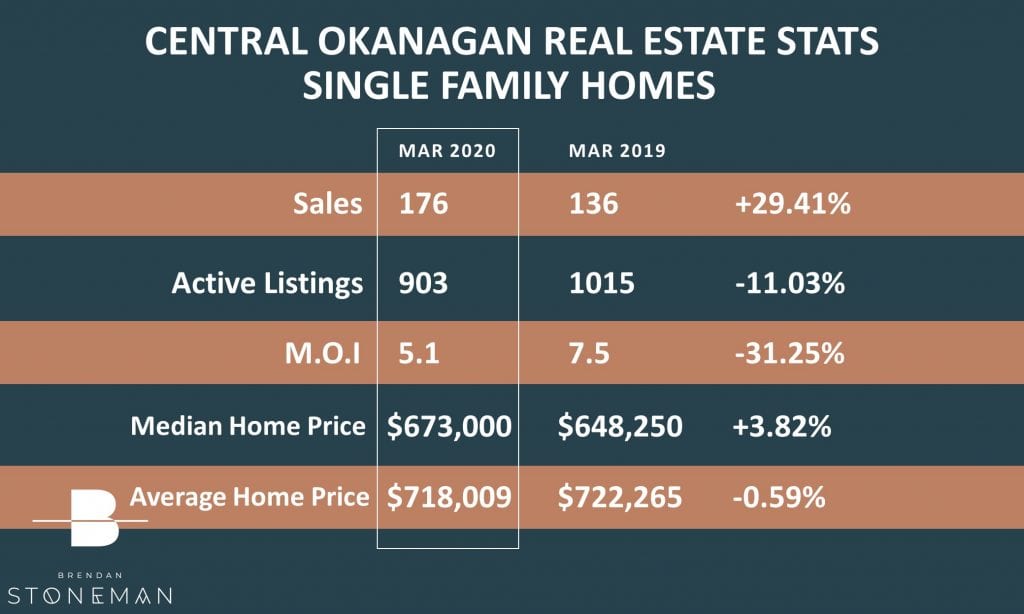
The March numbers for the Single Family Home property category were impressive! We saw a sales increase of nearly 30%, which was coupled with an 11% decrease in inventory.
The homes priced under $800,000 remain by far the most active, while the luxury market remains fairly soft!
The average price for a Single Family Home in March was just under $720,000
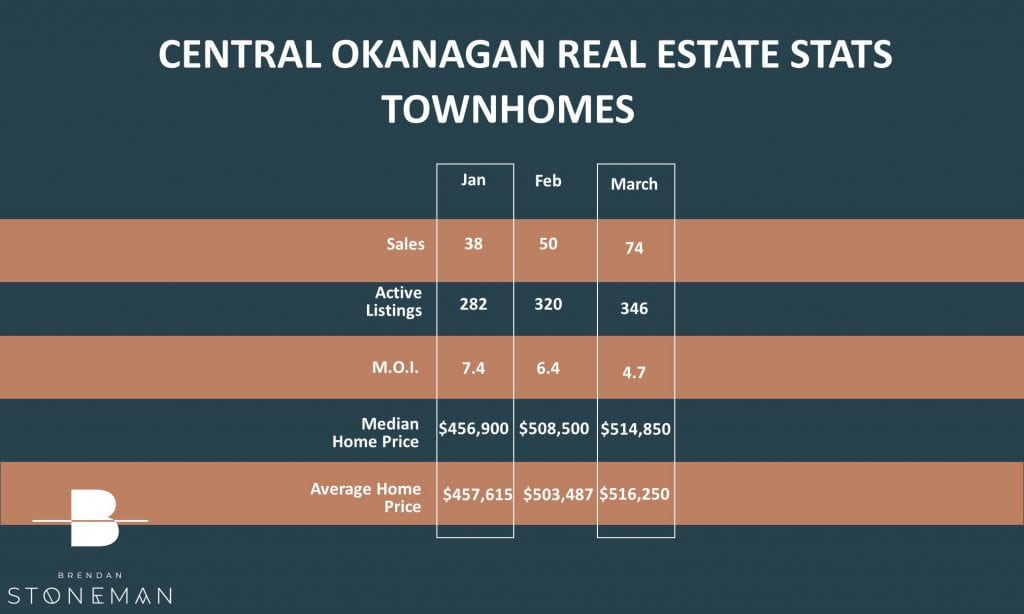
TOWNHOUSE MARKET UPDATE
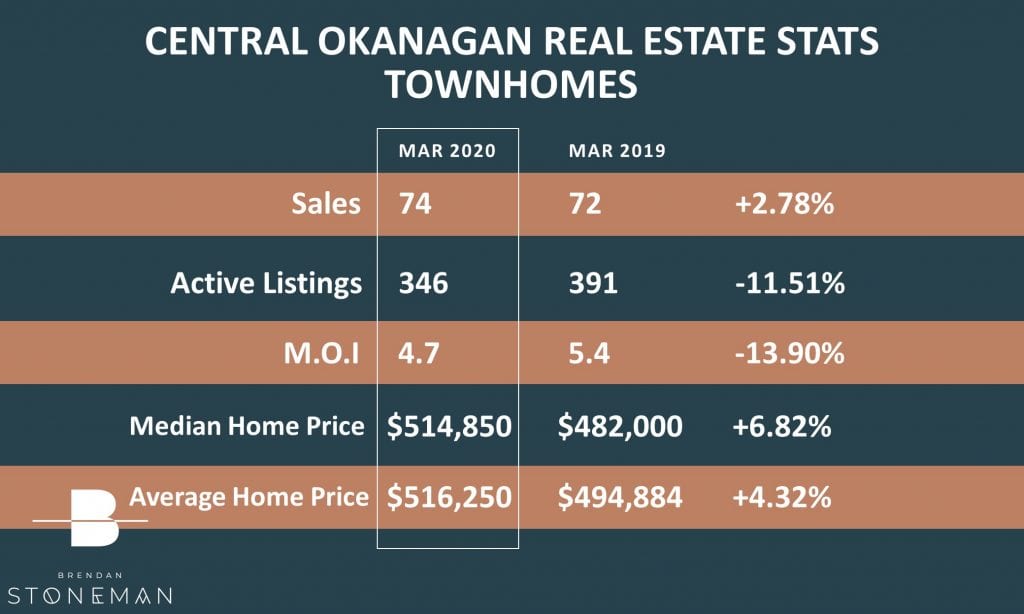
The townhouse market posted another strong month as well! With an 11.5% reduction in inventory over last March and a slight increase in sales, the townhouse segment is creeping into a Seller’s market. This has caused the average sale price to jump up to $516,250, an increase of nearly 5% over last year.
In short, the market could use more townhomes…this could be a good time for townhome owners to consider making the move up to a single family home!
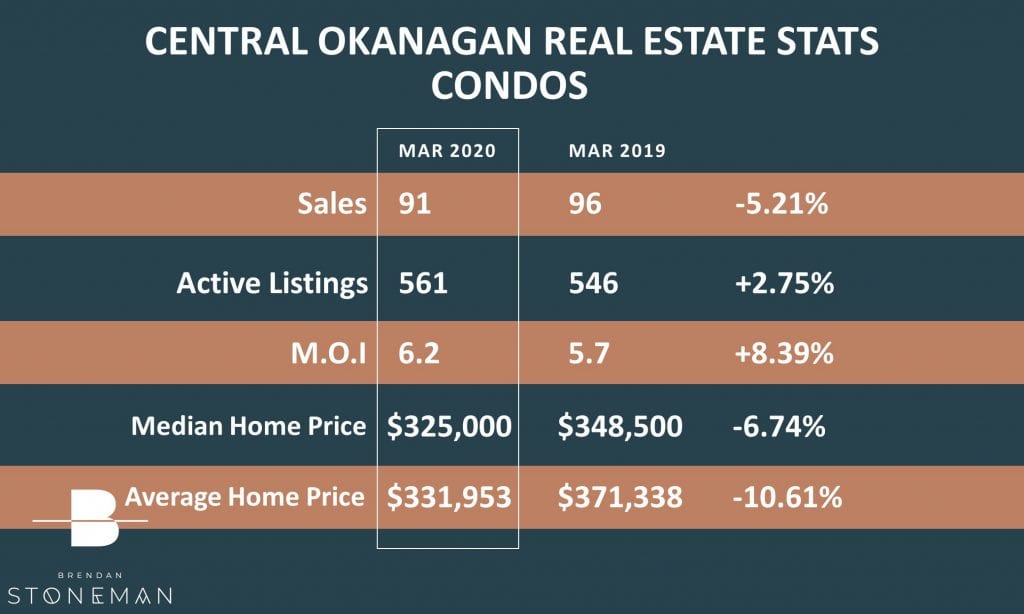
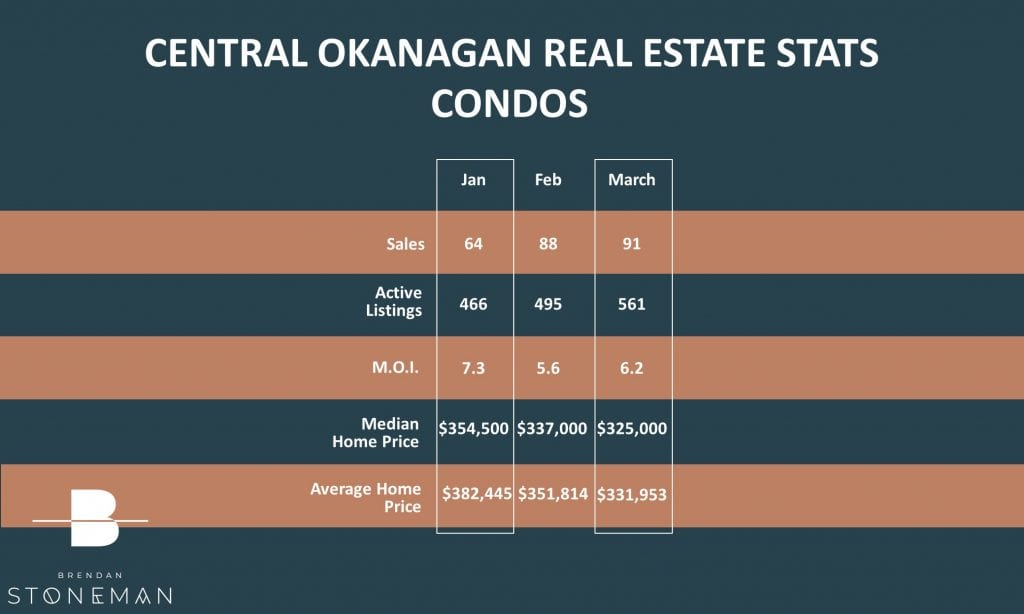
CONDO MARKET UPDATE
The condo market is showing some signs of slowing down. While the rest of the market posted excellent numbers in March, the condo sales saw a 5% decrease and a inventory increase of nearly 3%.
It’s a Buyer’s market for condo shoppers, as there was a decrease in the average condo price of 10.6% over last year.
This is the likely result of the condo insurance premium and deductible increases which started causing concern earlier this year, and did prompt some buyers to put their condo buying plans on hold. Time will tell how the condo market fares compared to the other property types as the year goes on.
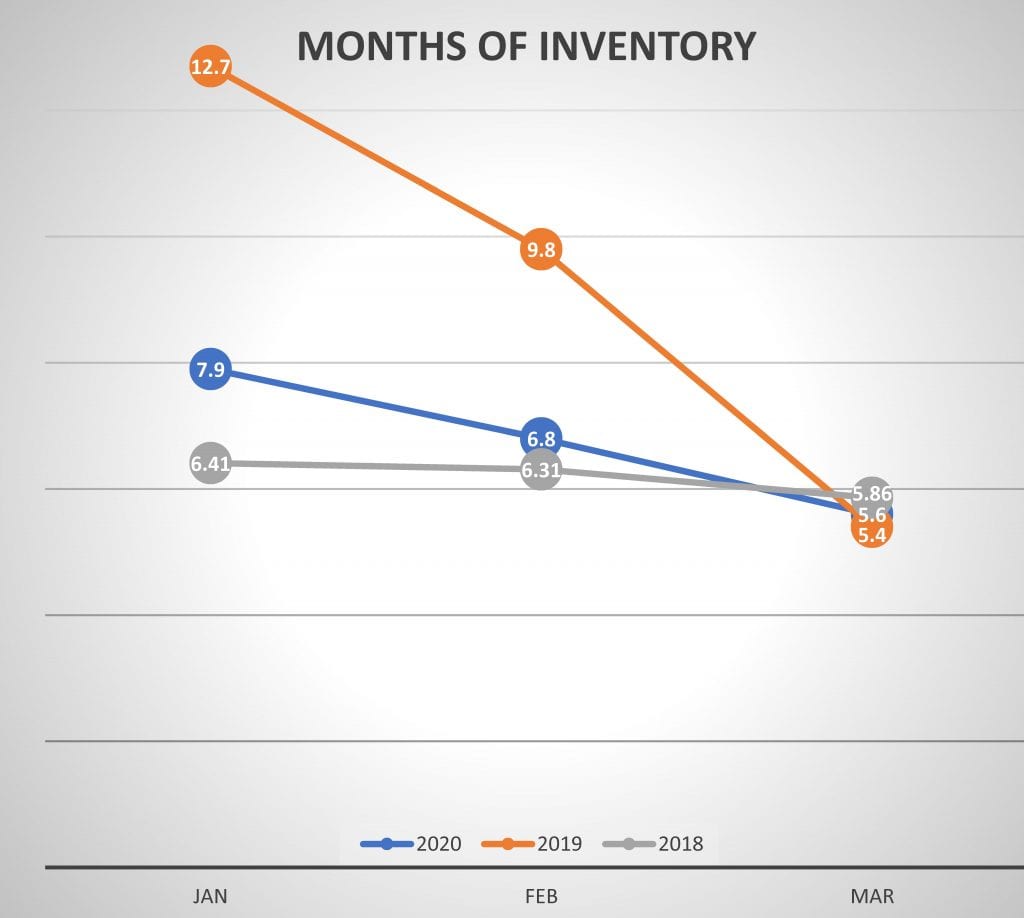
SUPPLY AND DEMAND
We’ve been tracking the Months of Inventory – the graph below outlines how the first 3 months of 2020 had been going compared to the same time periods in 2019 and 2018.
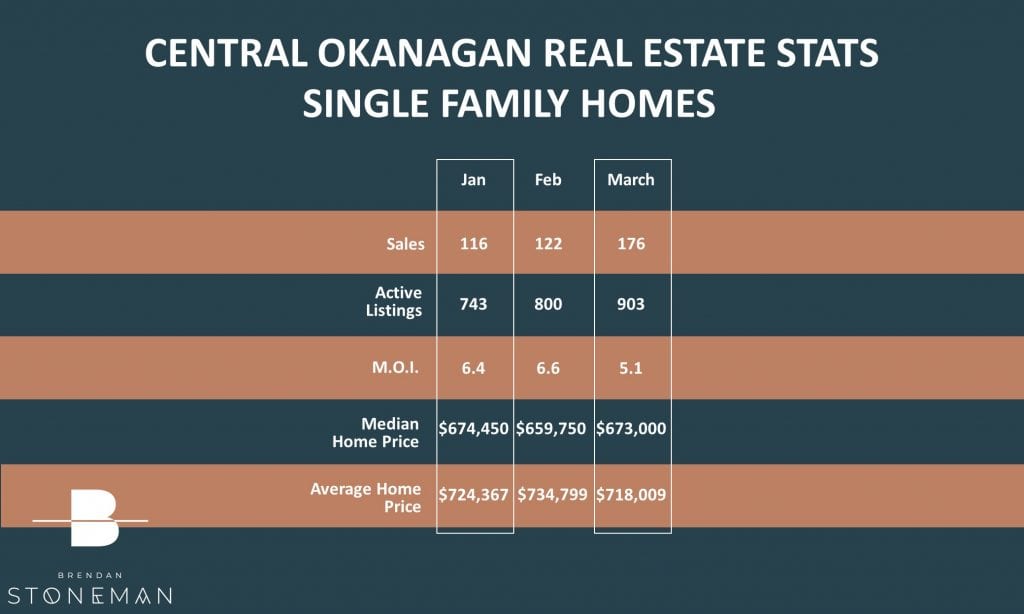
The 2018 year started off strong and then really slowed down in the second half…2019 did the exact opposite! So far this year, we started off at 7.9 Months of inventory in January, and we saw that drop to 6.8 months of inventory in February, and it continued to decrease in March to 5.6.
The months of inventory levels are our best way to determine the strength or weakness of the market…and to recap our benchmarks:
Less than 4 Months of Inventory is a Seller’s Market
4 to 6 Months of Inventory is a Balanced Market
More than 6 Months of Inventory is a Buyer’s Market
The April numbers are going to be very interesting. There has been a sharp reduction in sales, but, so far that has been met equally by a decrease in new listing inventory.
Despite the COVID-19 virus situation, we are still open for business! I have been utilizing video, 360 virtual tours, electronic document signing, video and great photography for years and can give our listings amazing exposure, despite the social distancing protocols in place.
Serious buyers are still shopping – If you have plans of making a move in 2020, let’s jump on a conference call or video chat, and we can discuss your plans.
Stay safe, and let me know if there is anything I can do to help.