

December 2021 – As we step into winter, has the market cooled off?
In November 2021, we saw nearly a 13% decrease in residential property sales over the previous year, and our total listing inventory dropped by 38% to 891 total listings. That being said, sales are still 150% of the 10 Year Average – so the market is without a doubt still red hot. Average and median prices have continued to creep up monthly without signs of slowing down – currently the overall average price (all residential property categories combined) is almost 26% above last year, landing at $861,835.
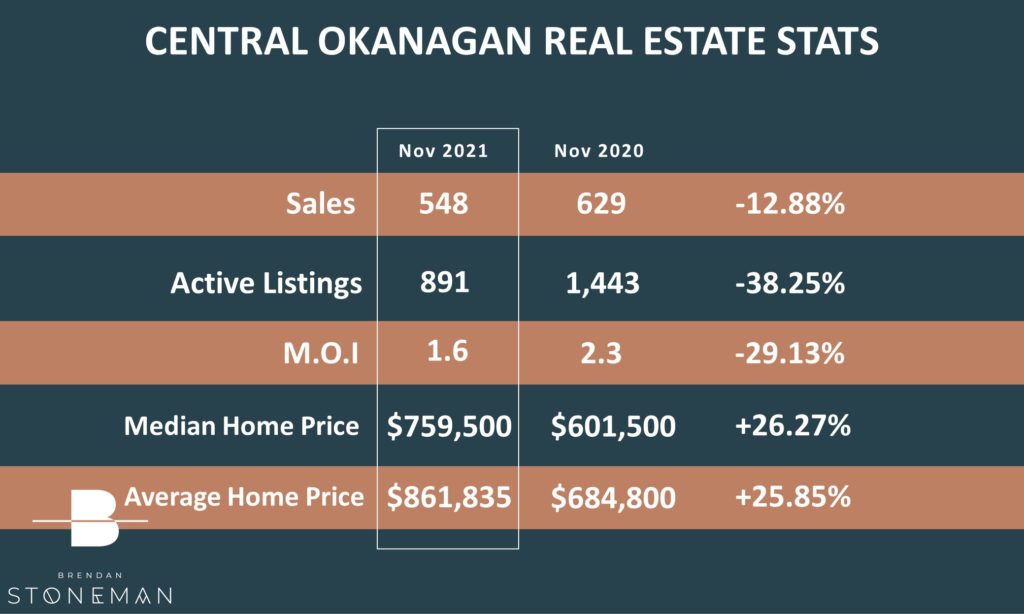
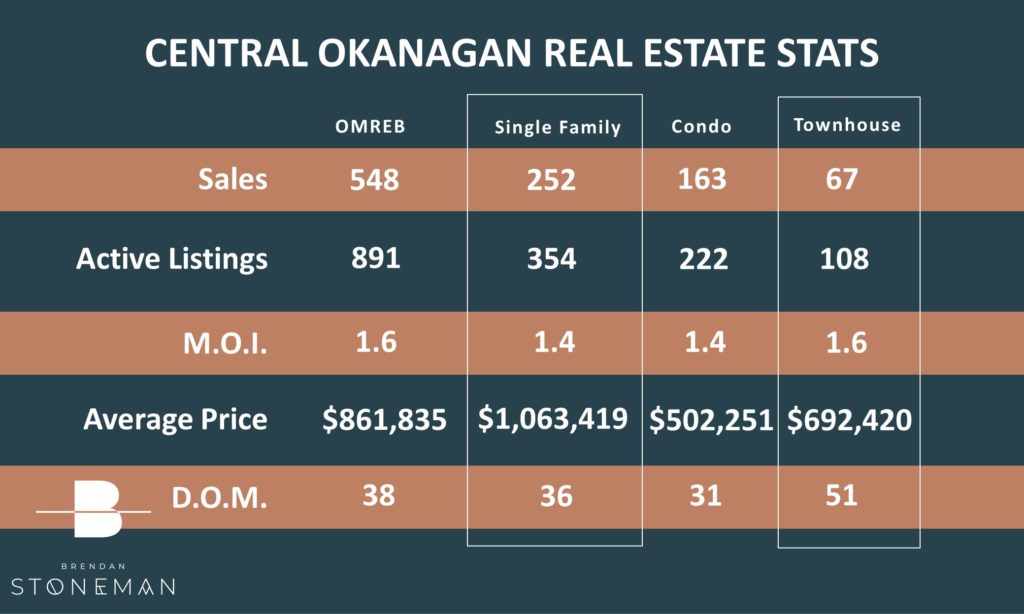
The table below shows the breakdown on where the 548 total monthly sales came from, and shows the total inventory levels for each property category.
On average, it is taking right around 38 days to sell a home, depending on the property type.
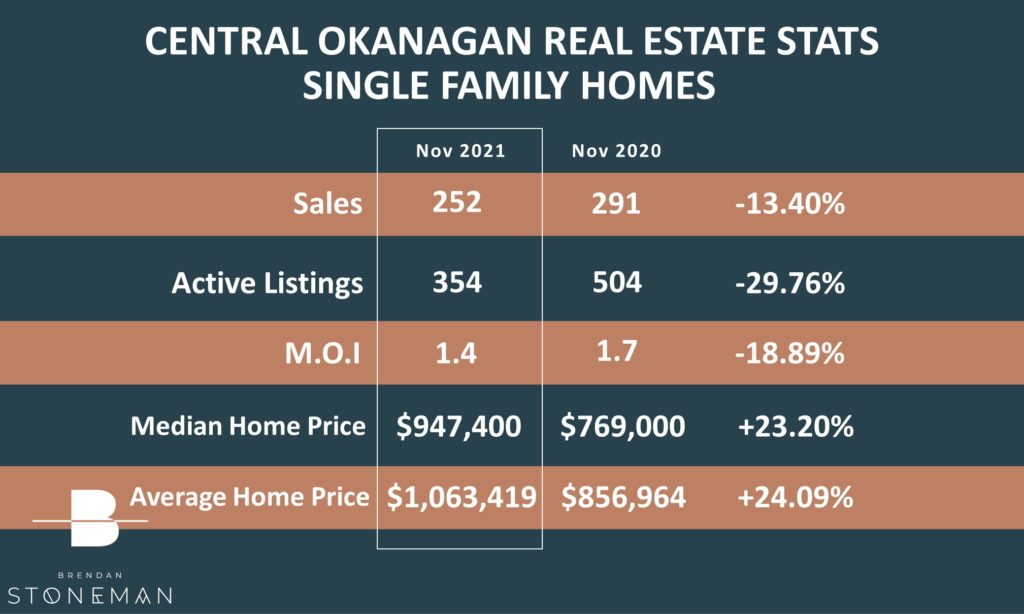
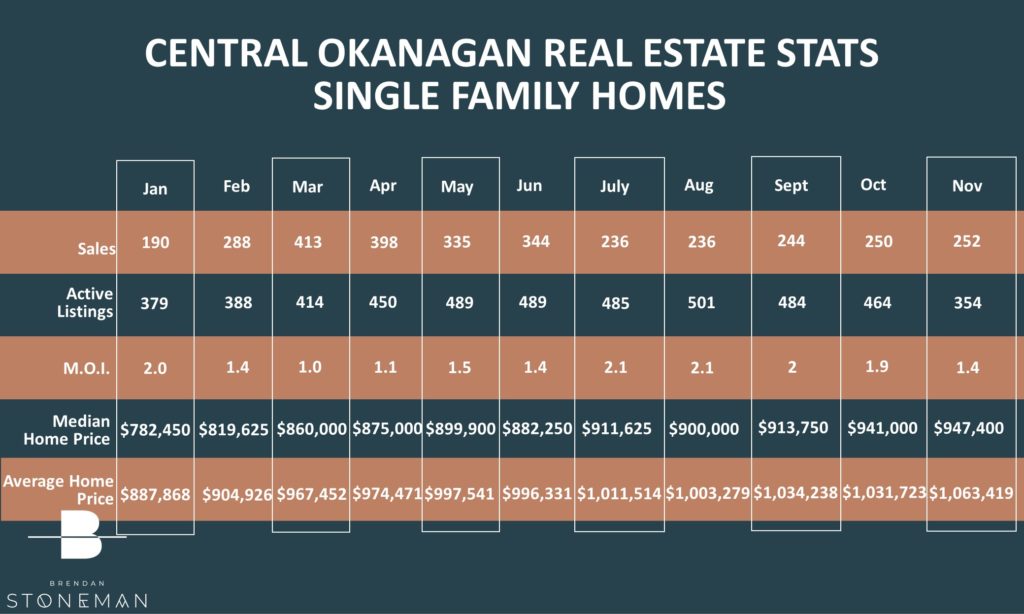
Single Family Home Market Update
In the Single Family Home bracket we saw a sales decrease of about 13% over November of last year. Although sales decreased, we are still holding position in a seller’s market when you couple that with the 29% decrease in inventory.
The average price for a Single Family Home in November continued to rise above the Million Dollar mark for the 5th month in a row, coming in at $1,063,419!
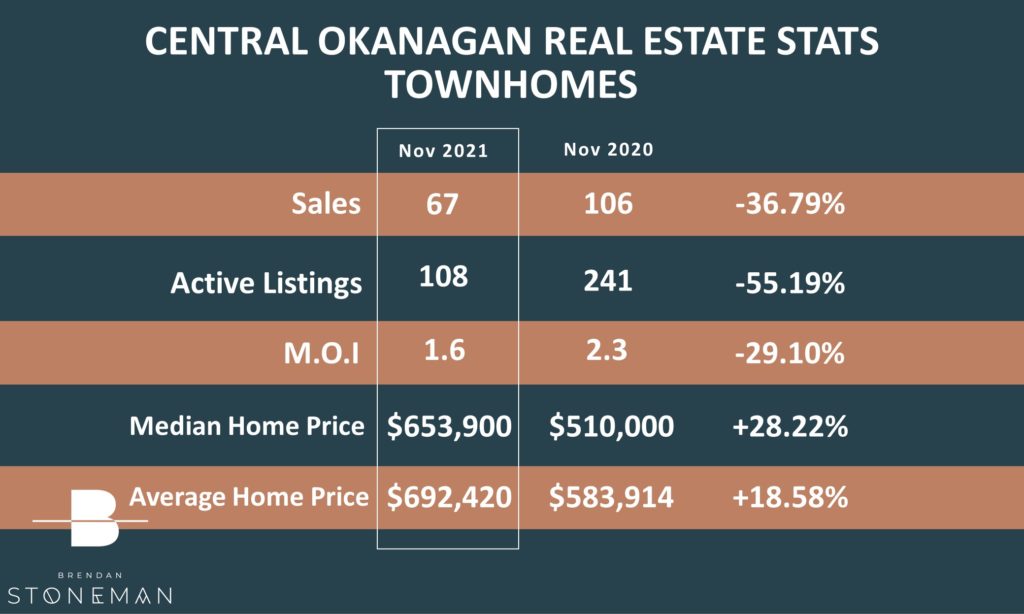
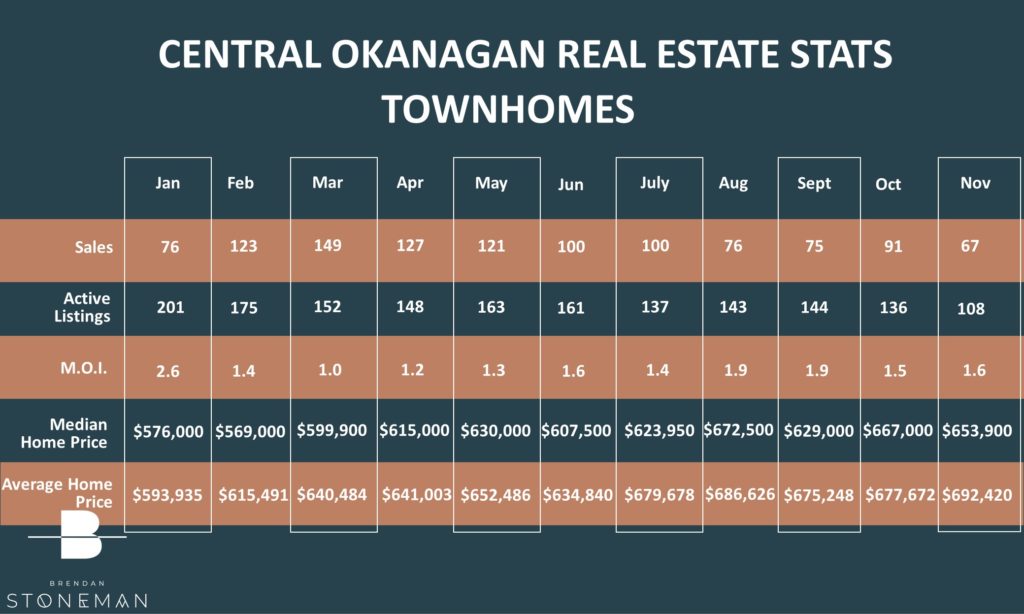
Townhouse Market update
The townhouse market is also still going strong. A nearly 55% reduction in inventory has led to townhomes making up only 32% of all available listings. The average sale price finished at $692,420 – an increase of 18.58% over the average from the same month last year.
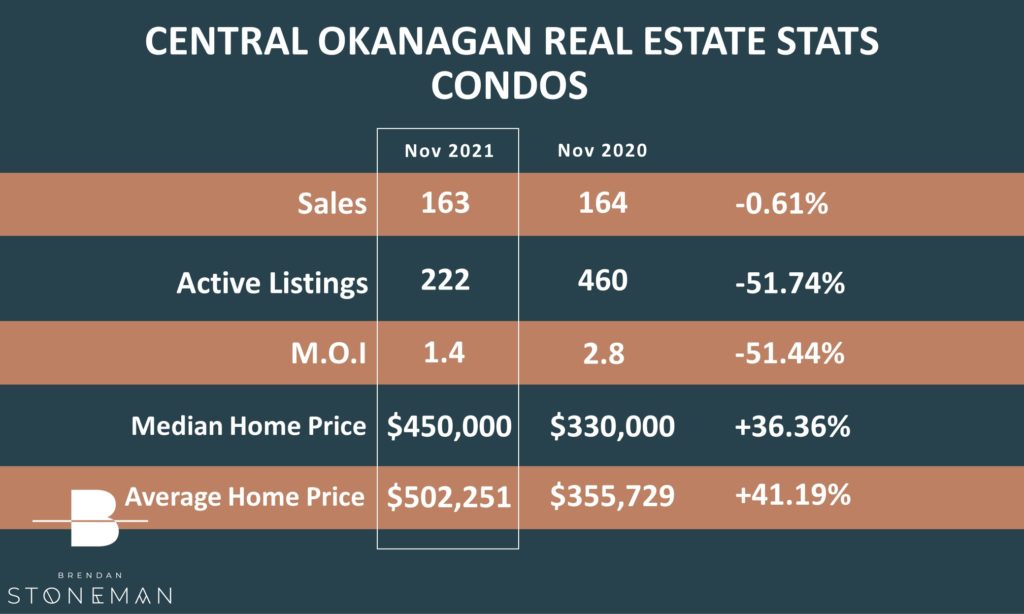
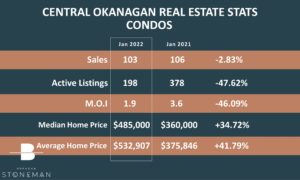
Condo Market update
The condo market has seen a minimal decrease in sales in comparison to this time last year. As with the other home categories we continue to see large decreases in inventory this year over last. The sales decreased by less than 1% while the inventory decreased by almost 52%!!

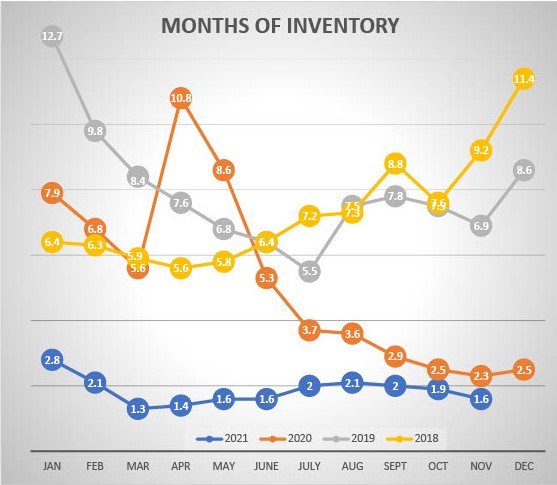
Supply & demand
The months of inventory levels are our best way to determine the strength or weakness of the market…and to recap our benchmarks:
Less than 4 Months of Inventory is a Seller’s Market
4 to 6 Months of Inventory is a Balanced Market
More than 6 Months of Inventory is a Buyer’s Market
We’ve been tracking the Months of Inventory – the graph below outlines how the first 11 months of 2021 have been going compared to the same time periods in the past 3 years. You will notice a difference – in 2020 there were 2.3 months of inventory whereas this year we are seeing only 1.6! This means if no new properties were listed, in just under 7 weeks, every single home in Kelowna would be sold and there would be nothing left to buy!
What does all this mean? Is now the time to make a move? I would love to discuss what may be right for you – Please feel free to reach out any time!


