

September 2021 – HOW’S THE MARKET looking Leading up to fall?
In August 2021, we saw a 18.75% decrease in residential property sales over the previous year, and our total listing inventory dropped by 51.73% to 1,131 total listings.
We also saw our overall average price jump 15.93% over last year to $785,632! (all residential property categories combined).
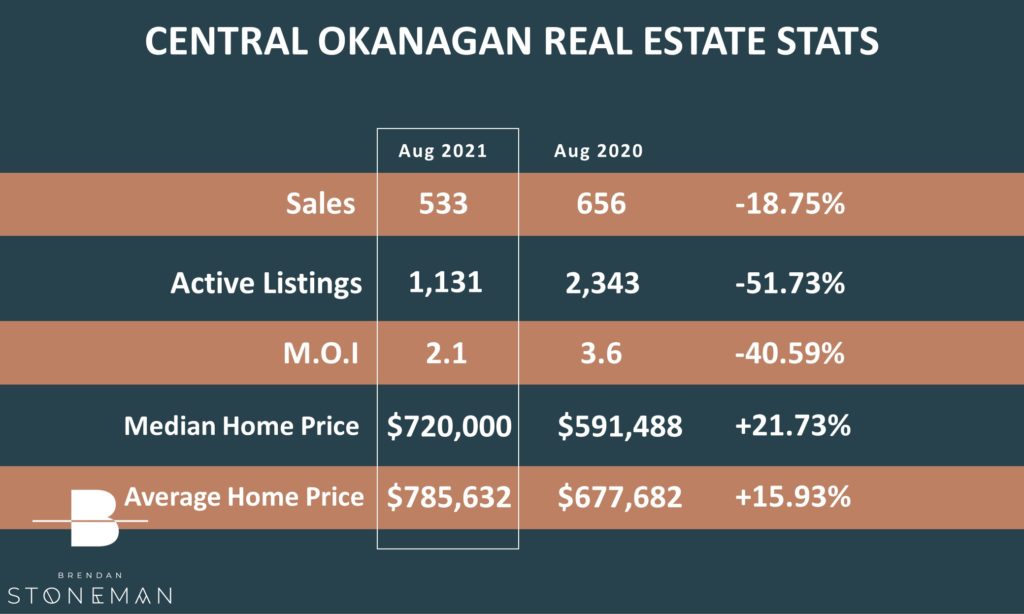
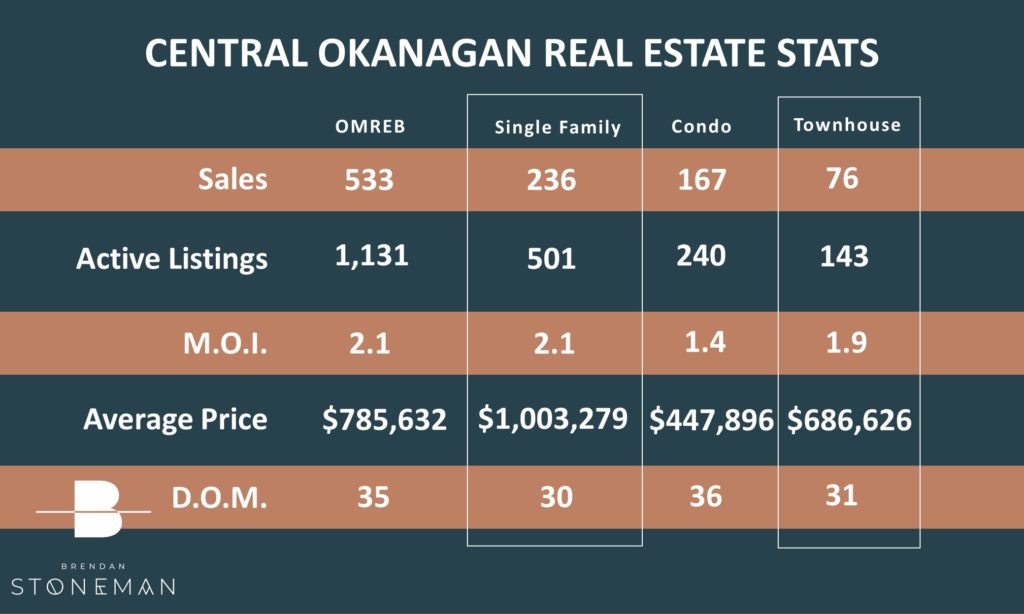
The table below shows the breakdown on where the 533 total monthly sales came from, and shows the total inventory levels for each property category.
On average, it is taking right around 35 days to sell a home, depending on the property type.
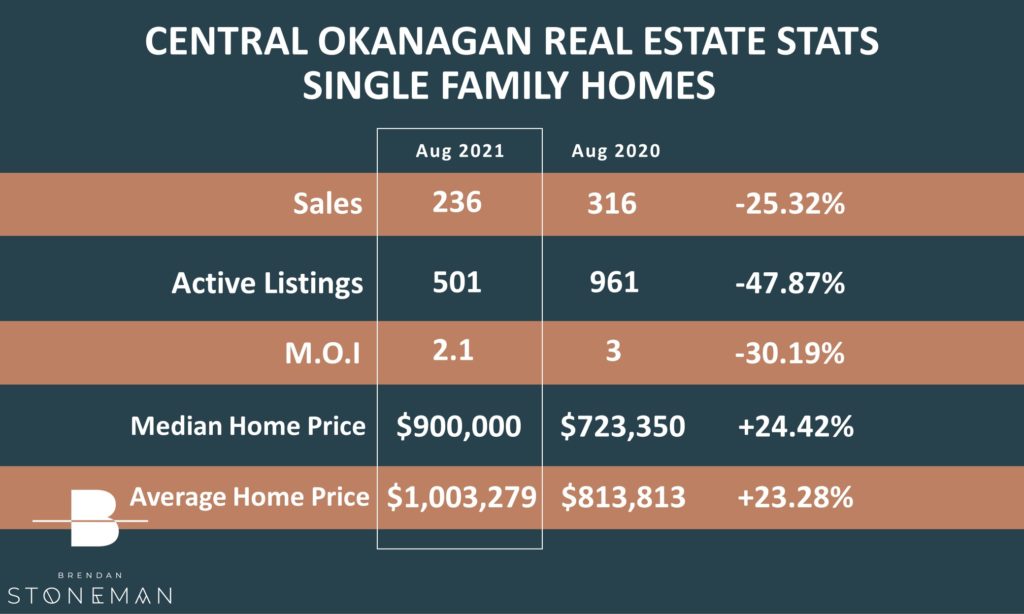
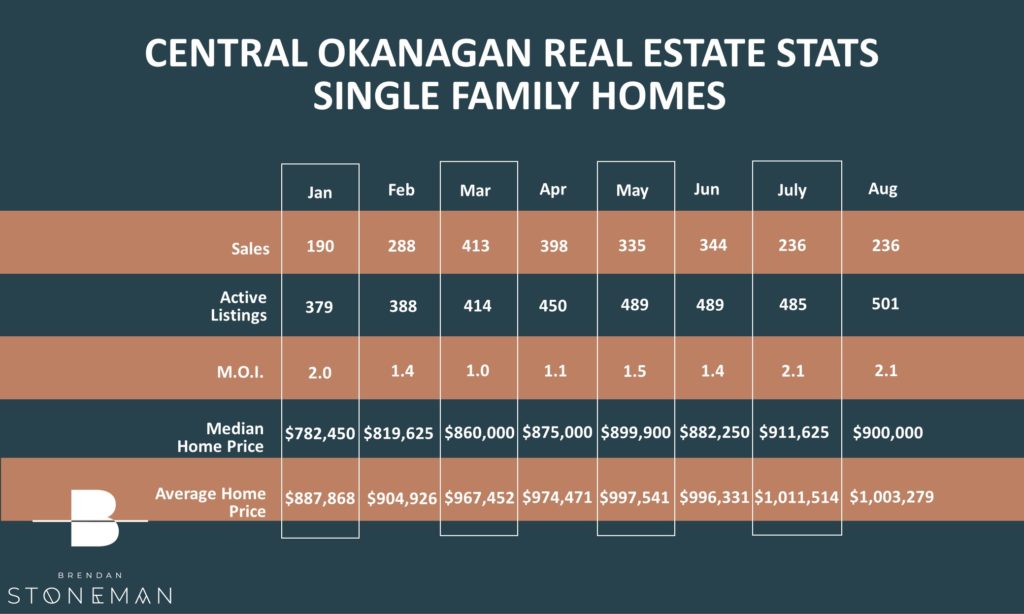
SINGLE FAMILY HOME MARKET UPDATE
In the Single Family Home bracket we saw a sales decrease of 25.32% over August of last year. Although sales decreased, we are still holding steadily in a seller’s market when you couple that with the 47.87% decrease in inventory.
The average price for a Single Family Home in August topped the Million Dollar mark for the second month in a row, rolling in at $1,003,279!
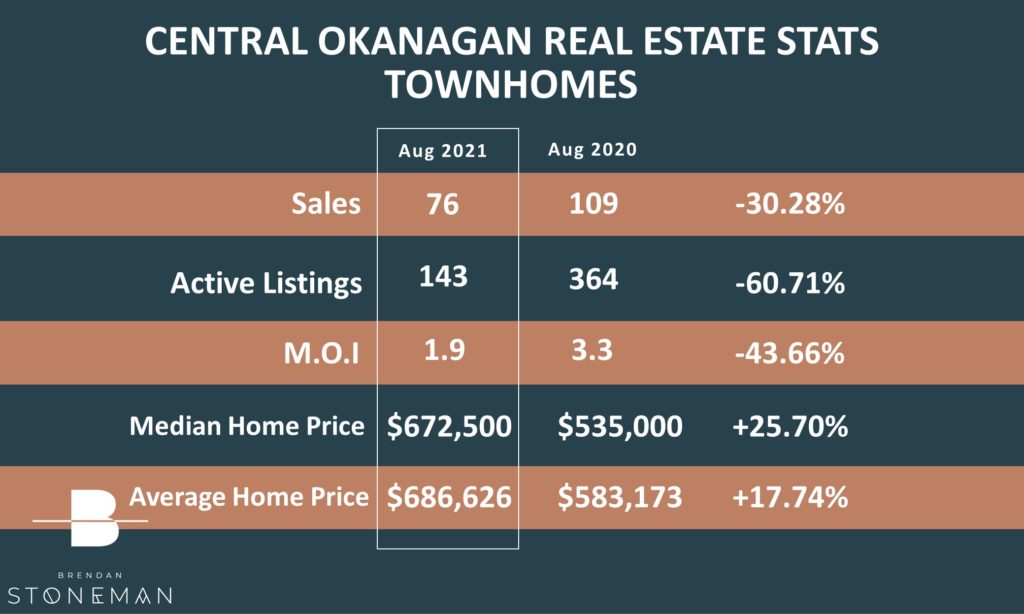
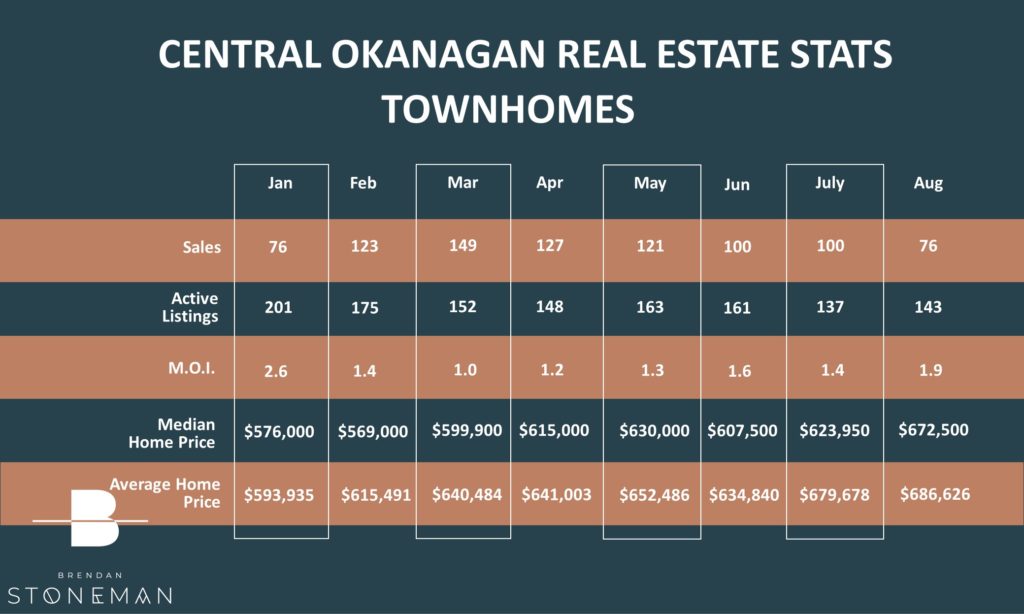
TOWNHOUSE MARKET UPDATE
The townhouse market is also still going strong despite a decrease in sales of 30.28% over last August. We also saw a 60.71% reduction in inventory. The average sale price finished at $686,626 – an increase of 17.74% over the average from the same month last year.
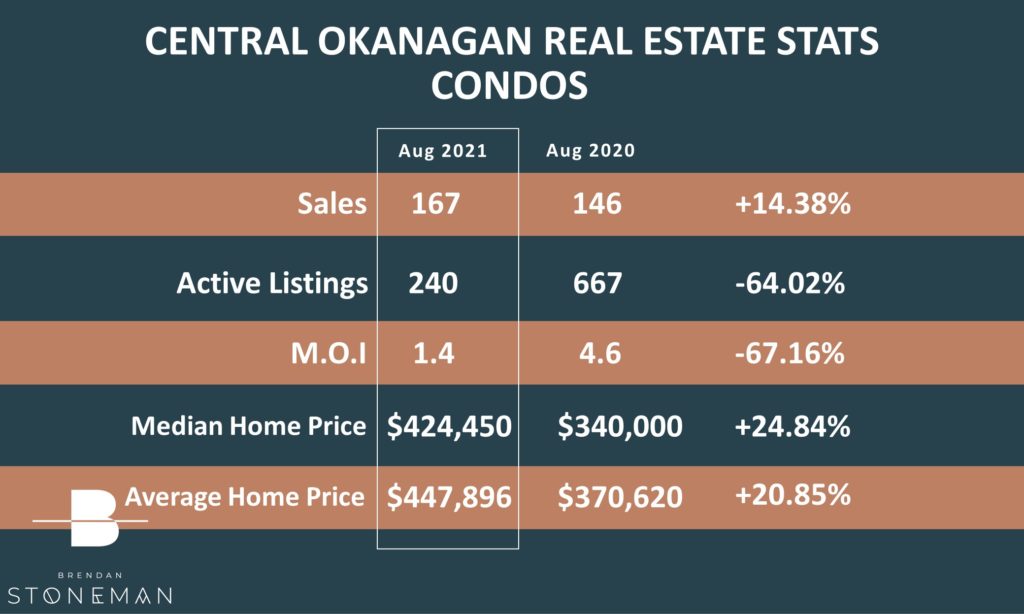
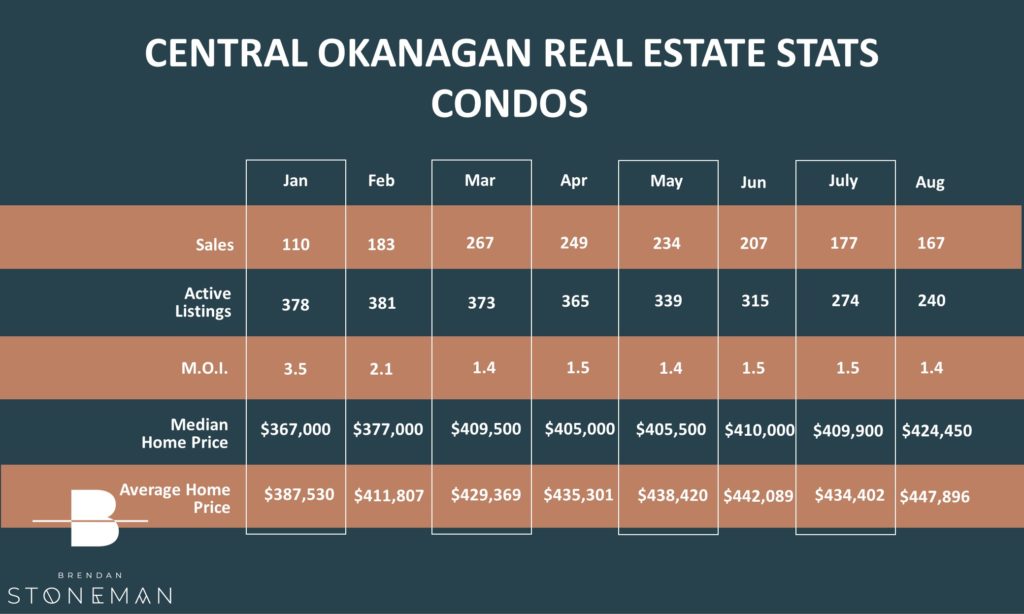
CONDO MARKET UPDATE
The condo market has seen an increase in sales in comparison to this time last year. As with the other home categories we continue to see large decreases in inventory this year over last. The sales increased by 14.38% while the inventory decreased by 64.02%.
SUPPLY & DEMAND
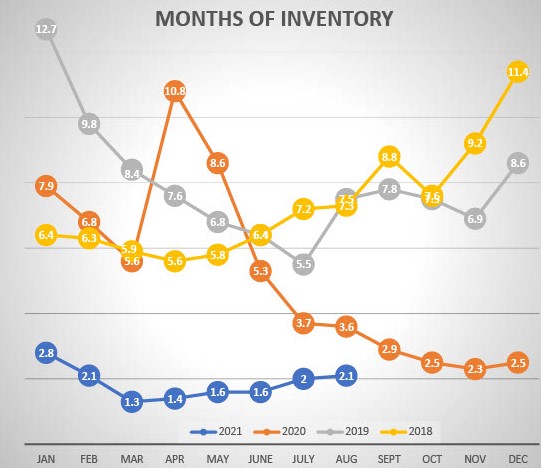
The months of inventory levels are our best way to determine the strength or weakness of the market…and to recap our benchmarks:
Less than 4 Months of Inventory is a Seller’s Market
4 to 6 Months of Inventory is a Balanced Market
More than 6 Months of Inventory is a Buyer’s Market
We’ve been tracking the Months of Inventory – the graph below outlines how the first 8 months of 2021 have been going compared to the same time periods in the past 3 years. You will notice a big difference – in 2020 there were 3.6 months of inventory whereas this year we are seeing only 2.1! This means if no new properties were listed, in 9 weeks, every single home in Kelowna would be sold and there would be nothing left to buy!!
Is now the time to make a move? I would love to discuss what may be right for you in this crazy market. Please feel free to reach out any time!


