

MARCH 2024 – INVENTORY LEVELS ON THE RISE
Last month we saw a continuation in the trend bringing an increased number of listings to our local real estate market! Below we have outlined how both the inventory levels and sales were distributed, and how it is affecting pricing in the respective sectors.
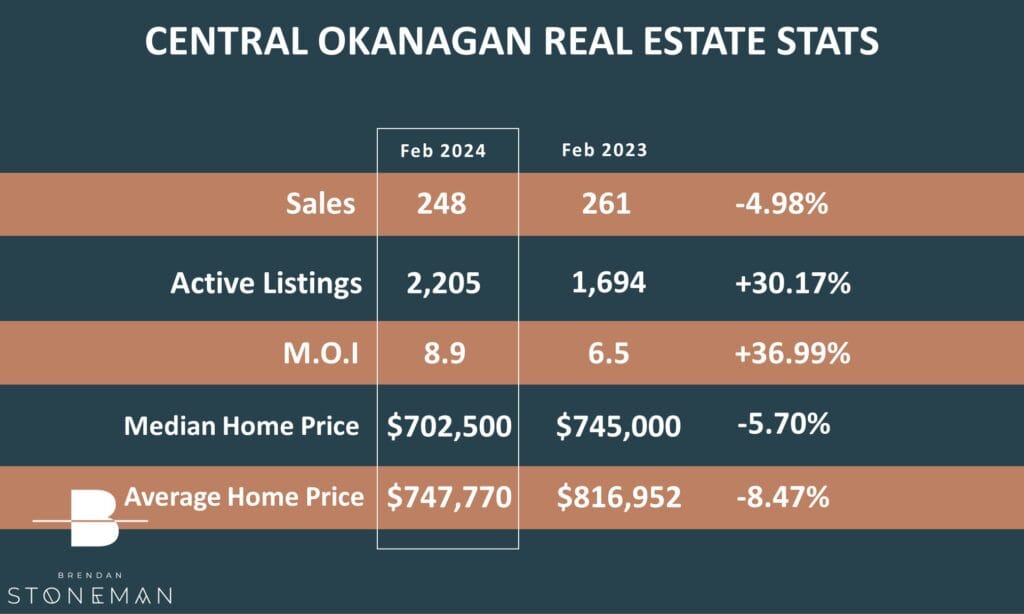
In February 2024, we saw a decrease of 5% in residential property sales over the previous year, while our total listing inventory increased by 30% to 2,205 listings in total. Currently, the overall average price (all residential property categories combined) is sitting 8% below the average during the same time last year, landing at $747,770
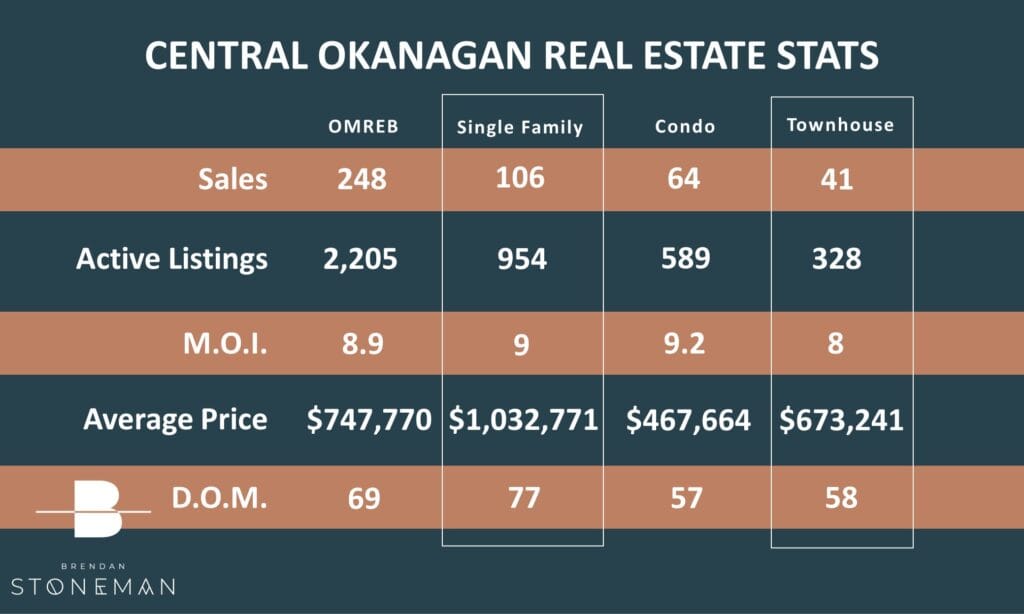
The table below shows the breakdown on where the 248 total monthly sales came from, and shows the total inventory levels for each property category.
On average, it is taking right around 69 days to sell a home, depending on the property type.
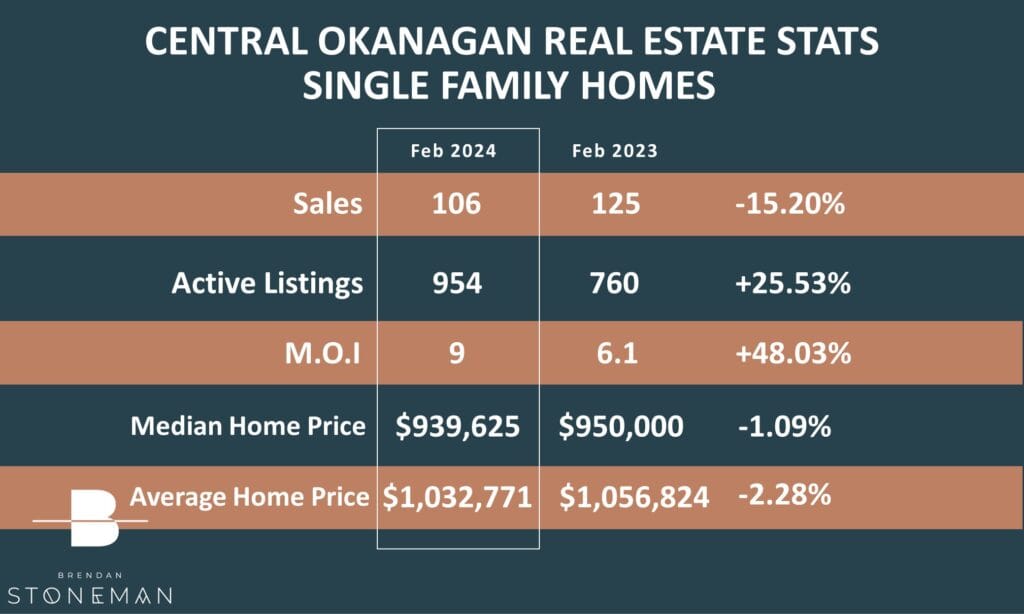
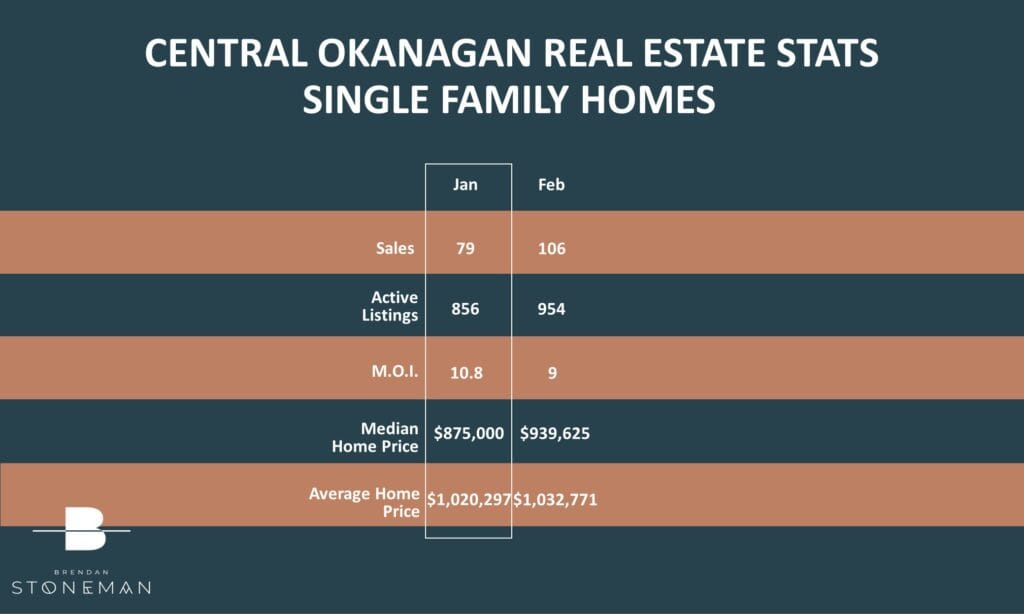
SINGLE FAMILY HOME MARKET UPDATE
In the Single Family Home bracket we saw a sales decrease of 15% coupled with a 25% increase in inventory over February of last year.
The average price for the month remained above the Million Dollar mark, however there was a small dip of about 2% below last February’s average price.
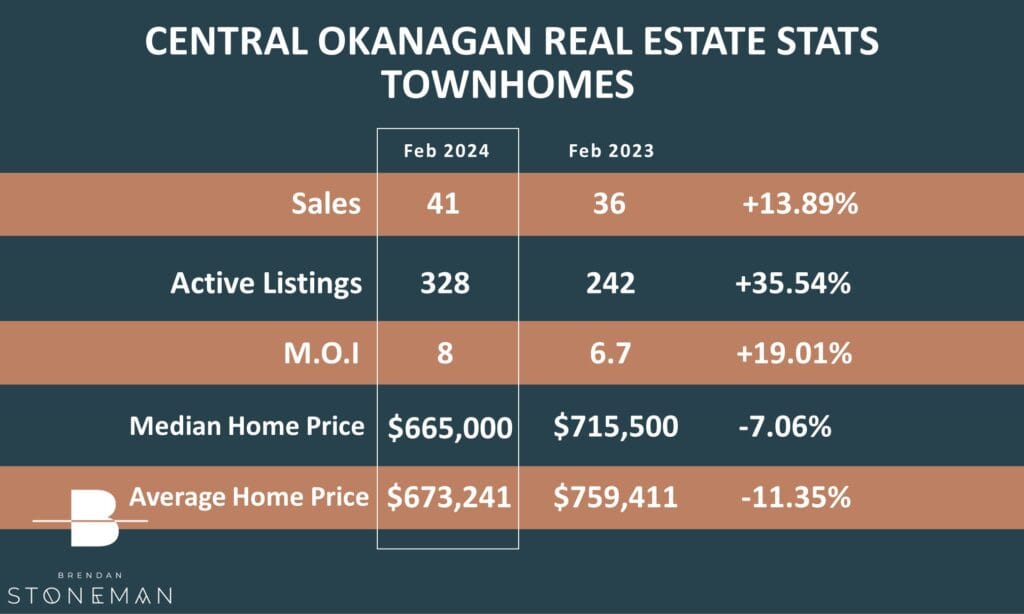
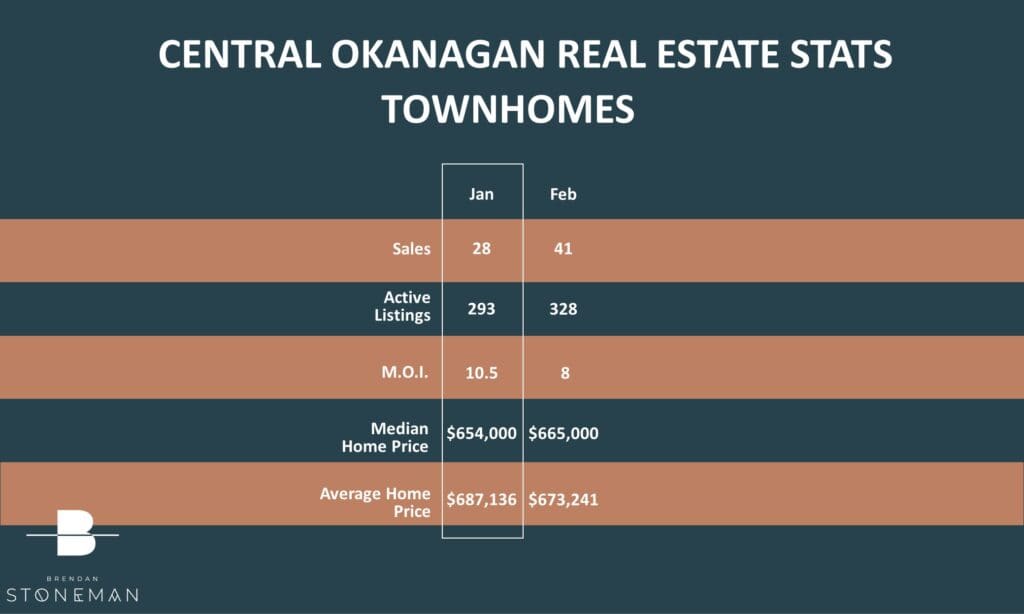
TOWNHOUSE MARKET UPDATE
The townhouse market is still in demand with a nearly 14% increase in sales over February of last year. Despite a 35% increase in inventory townhomes are still only making up less than 15% of all available listings. The average sale price finished at $673,241 – a decrease of 11% from the average of the same month last year.
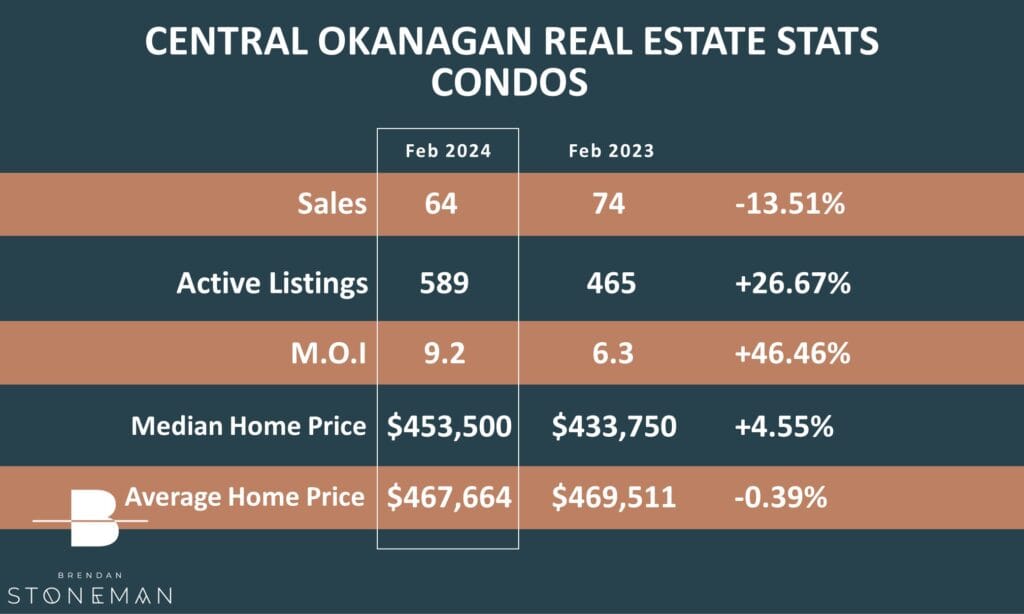
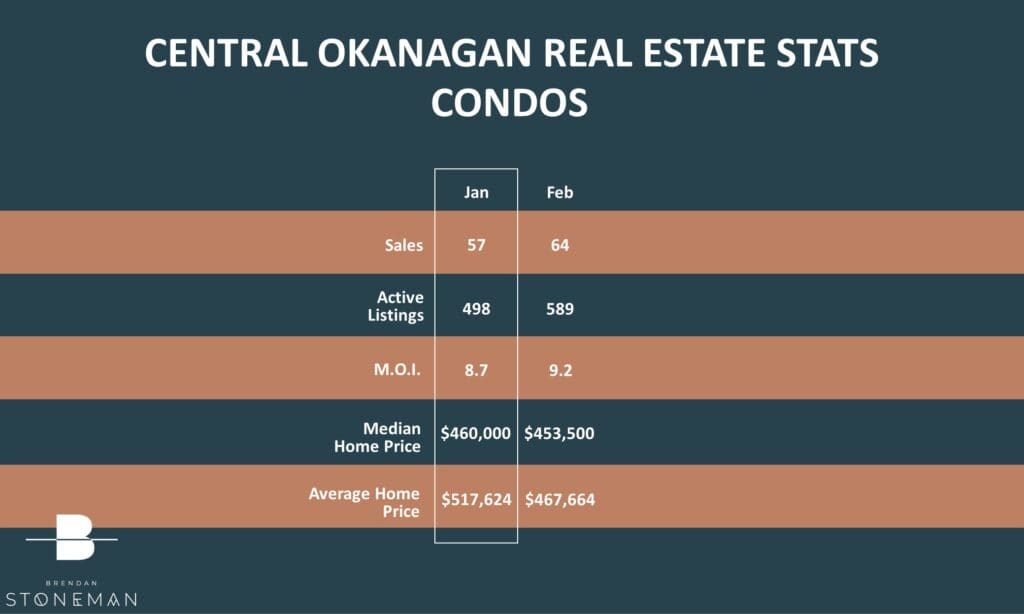
CONDO MARKET UPDATE
The condo market has seen a dip in sales in comparison to this time last year. We also continue to see significant increases in inventory this year over last. The sales decreased by about 13% while the inventory increased by 26%.
SUPPLY & DEMAND
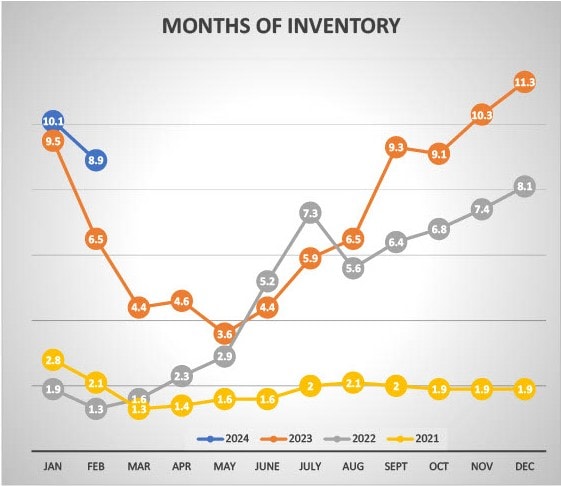
The months of inventory levels are our best way to determine the strength or weakness of the market…and to recap our benchmarks:
Less than 4 Months of Inventory is a Seller’s Market
4 to 6 Months of Inventory is a Balanced Market
More than 6 Months of Inventory is a Buyer’s Market
We’ve been tracking the Months of Inventory – the graph below outlines how the 2nd month of 2024 went compared to the same time periods in the previous 3 years. In February of 2023 there were 6.5 months of inventory whereas this year we are seeing 8.9. This means we are continuing to sit in a strong buyers market at this time.
What does all this mean? Is now the time to make a move? I would love to discuss what may be right for you – Please feel free to reach out any time!

