

SEPTEMBER 2023 – HOME SALES WINDING DOWN FOR THE SEASON?
This summer we have been watching home sale numbers fluctuate, while the listing inventory has started to see some growth! Could the added variety available bring more buyers into play despite higher interest rates?
In August 2023, we saw an decrease of 8% in residential property sales over the previous year, while our total listing inventory increased by over 6% to 2,338 listings in total. The overall average price (all residential property categories combined) is sitting 2% below the average during the same time last year, landing at $819,203.
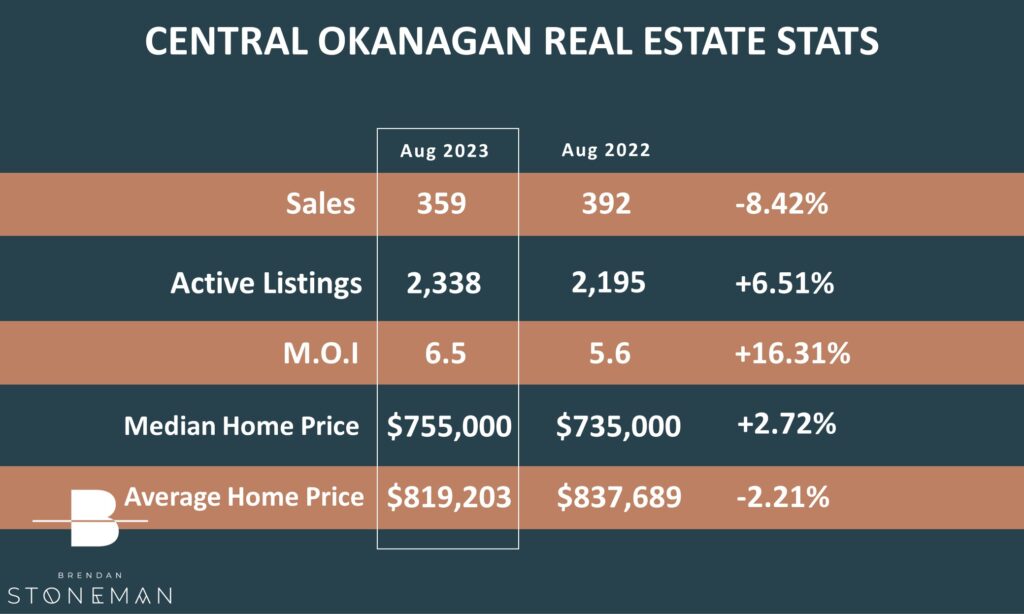
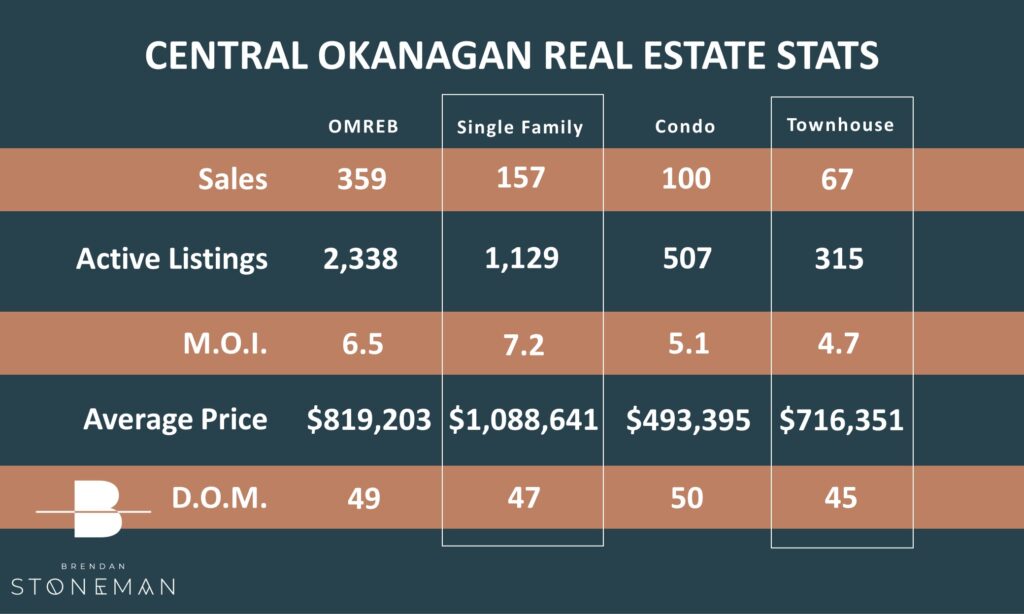
The table below shows the breakdown on where the 359 total monthly sales came from, and shows the total inventory levels for each property category.
On average, it is taking right around 49 days to sell a home, depending on the property type.
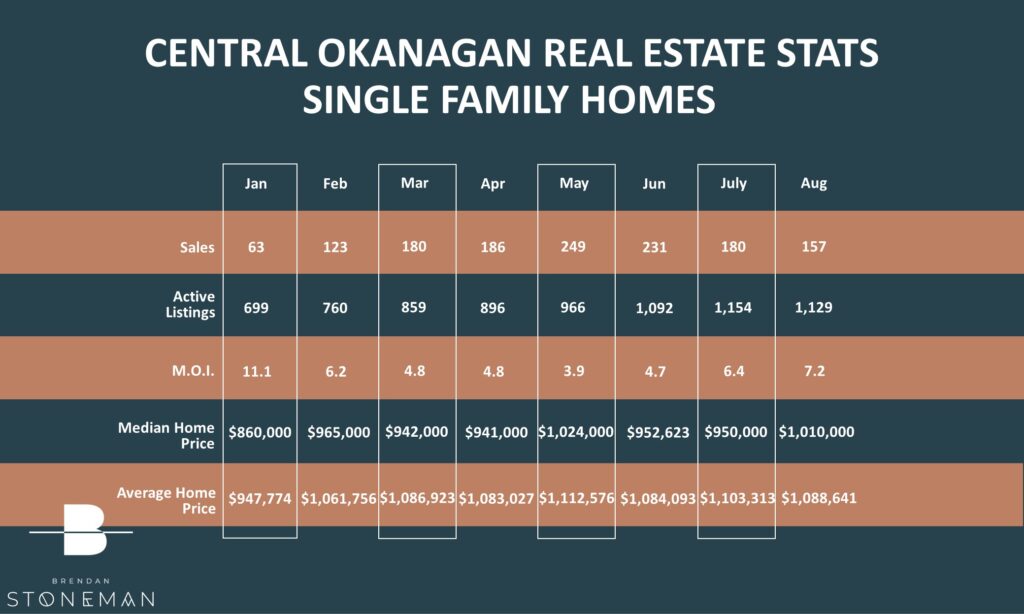
SINGLE FAMILY HOME MARKET UPDATE
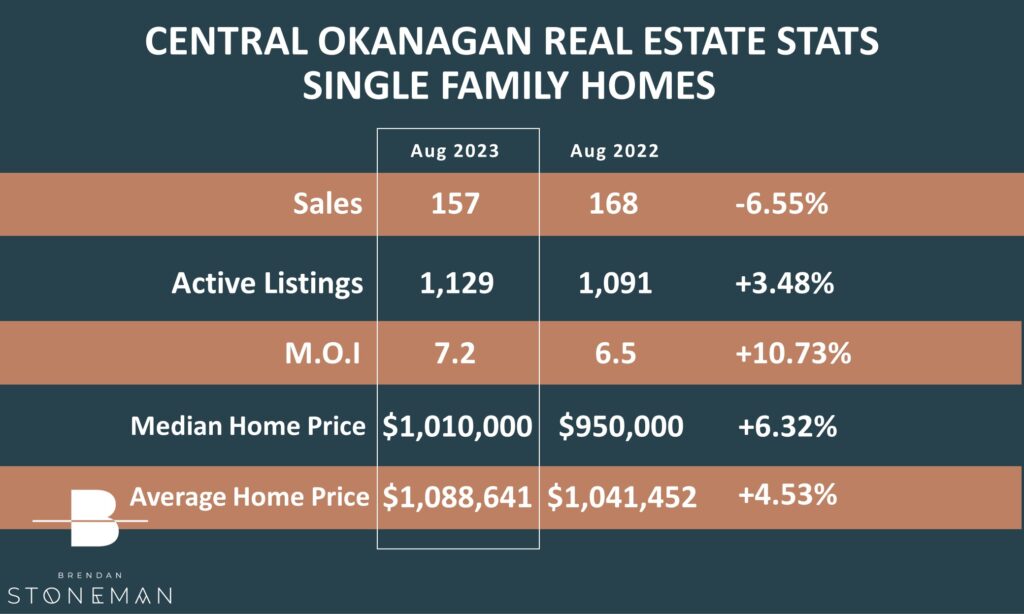
In the Single Family Home bracket we saw a sales decrease of 6% coupled with a 3% increase in inventory over August of last year.
The average price for the month remained above the Million Dollar mark, while also coming in 4% above last August’s average price.
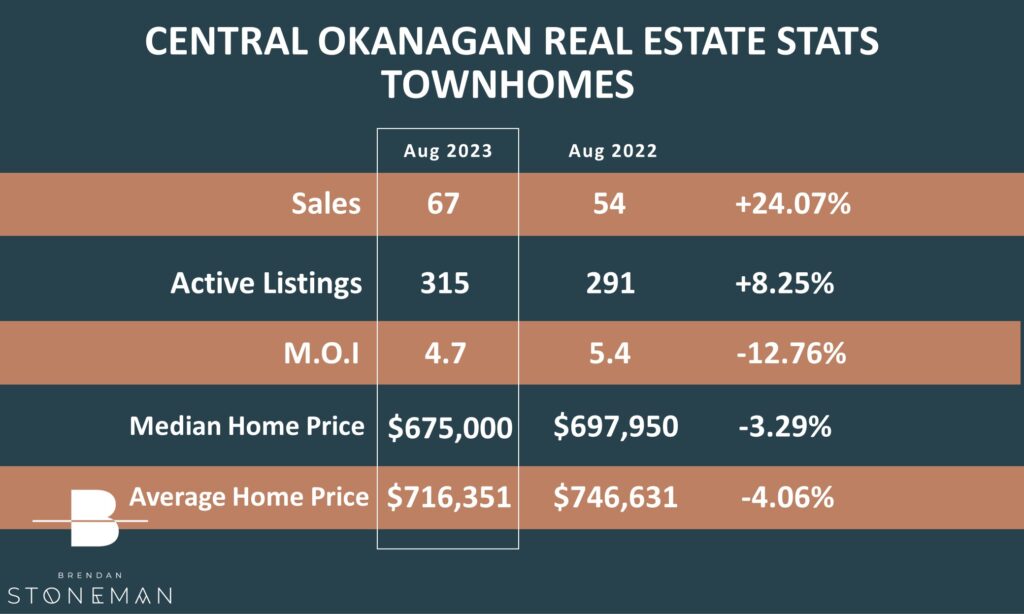
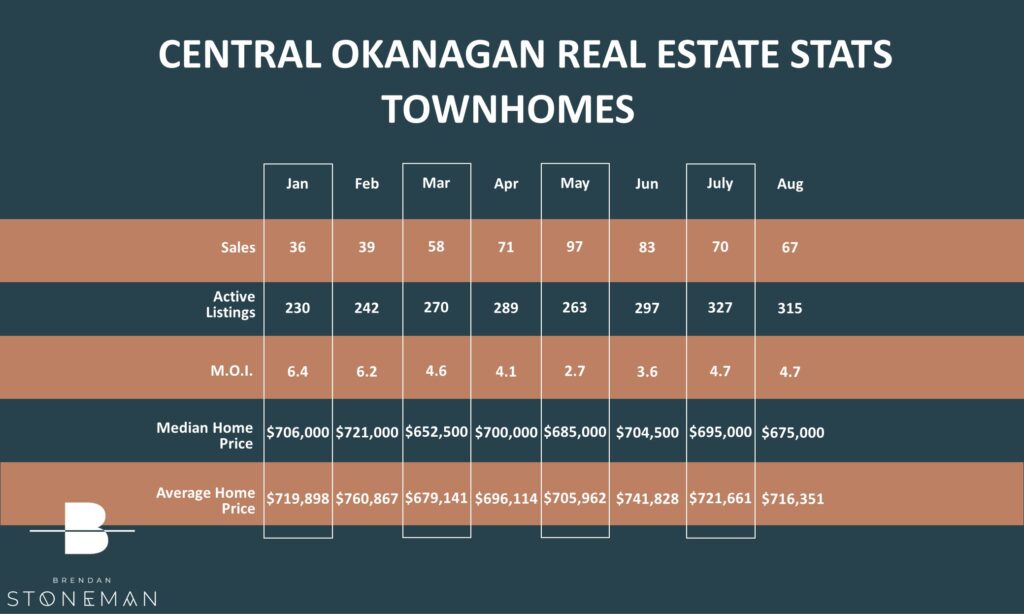
TOWNHOUSE MARKET UPDATE
The townhouse market has remained in high demand. Despite a 8% increase in inventory townhomes are still only making up 13% of all available listings. The average sale price finished at $716,351 – a 4% decrease from the average of the same month last year.
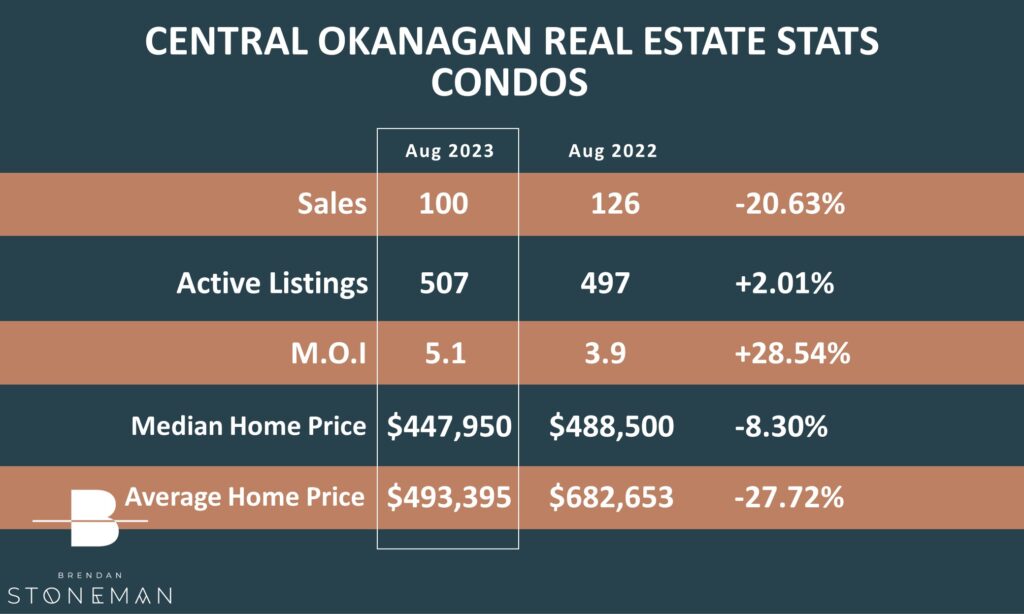
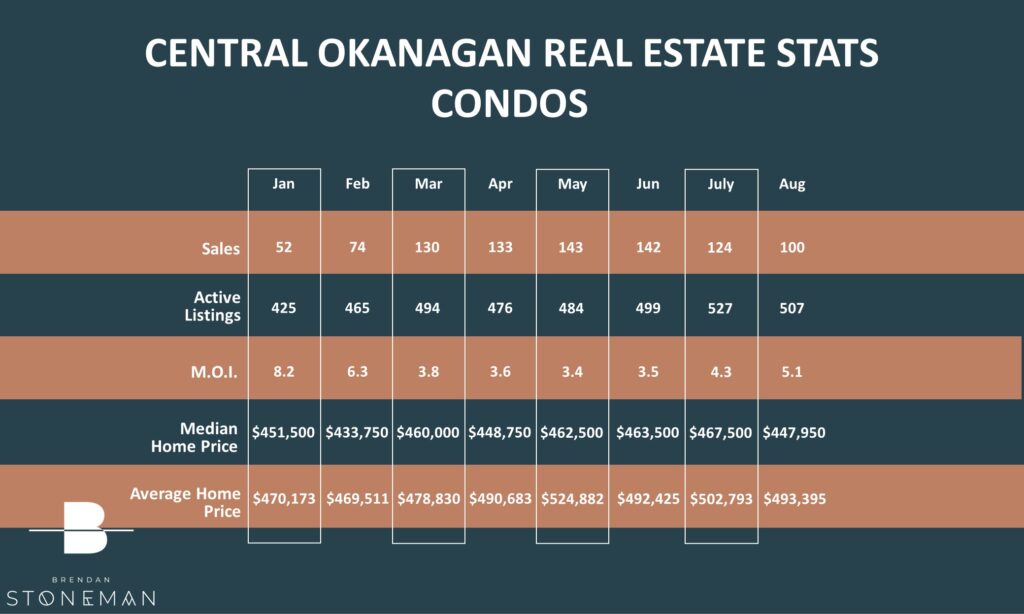
CONDO MARKET UPDATE
The condo market has also seen a significant decrease in sales in comparison to this time last year. We continue to see increases in inventory this year over last. The sales decreased by 20% while the inventory increased by only 2%.
SUPPLY & DEMAND
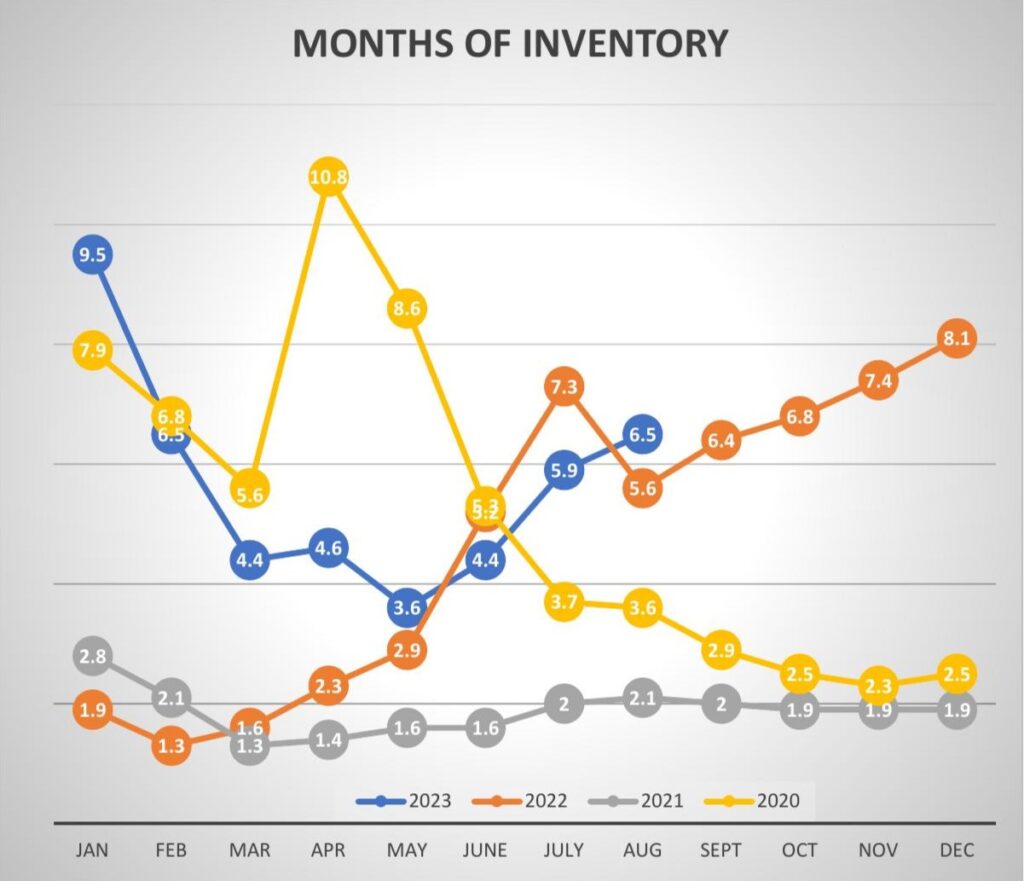
The months of inventory levels are our best way to determine the strength or weakness of the market…and to recap our benchmarks:
Less than 4 Months of Inventory is a Seller’s Market
4 to 6 Months of Inventory is a Balanced Market
More than 6 Months of Inventory is a Buyer’s Market
We’ve been tracking the Months of Inventory – the graph below outlines how the 8th month of 2023 went compared to the same time periods in the previous 3 years. In August of 2022 there were 5.6 months of inventory whereas this year we are seeing 6.5. This means we are sitting on the edge of a buyers market at this time.
What does all this mean? Is now the time to make a move? I would love to discuss what may be right for you – Please feel free to reach out any time!

