

JANUARY 2024 – THE 2023 MARKET COMES TO A CLOSE
In the last month of 2023 the Central Okanagan real estate market has continued to see a dramatic growth in active listings available in comparison to the previous years numbers. The Months Of Inventory level has also continued to reach up to a high we haven’t seen in years! Heading into 2024 with a large inventory will create more opportunity and selection for buyers, especially as the snow melts and leads the way into what is traditionally the busiest season in the real estate market.
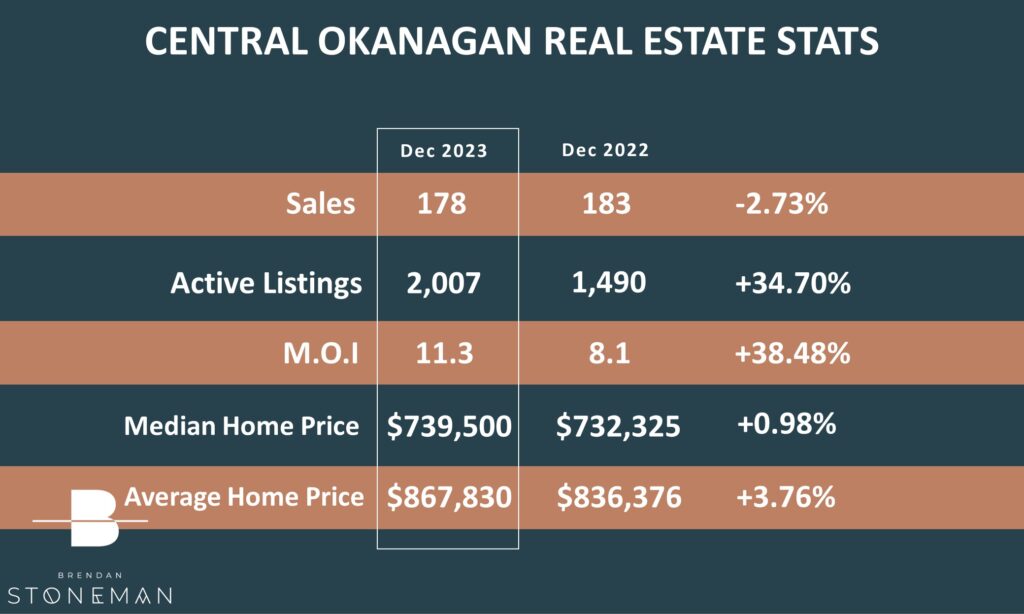
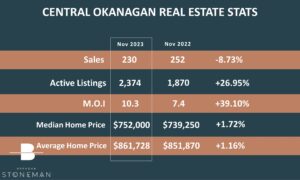
In December 2023, we saw an decrease of nearly 3% in residential property sales over the previous year, while our total listing inventory increased by 34% to 2,007 listings in total. Currently, the overall average price (all residential property categories combined) is sitting nearly 4% above the average during the same time last year, landing at $867,830.
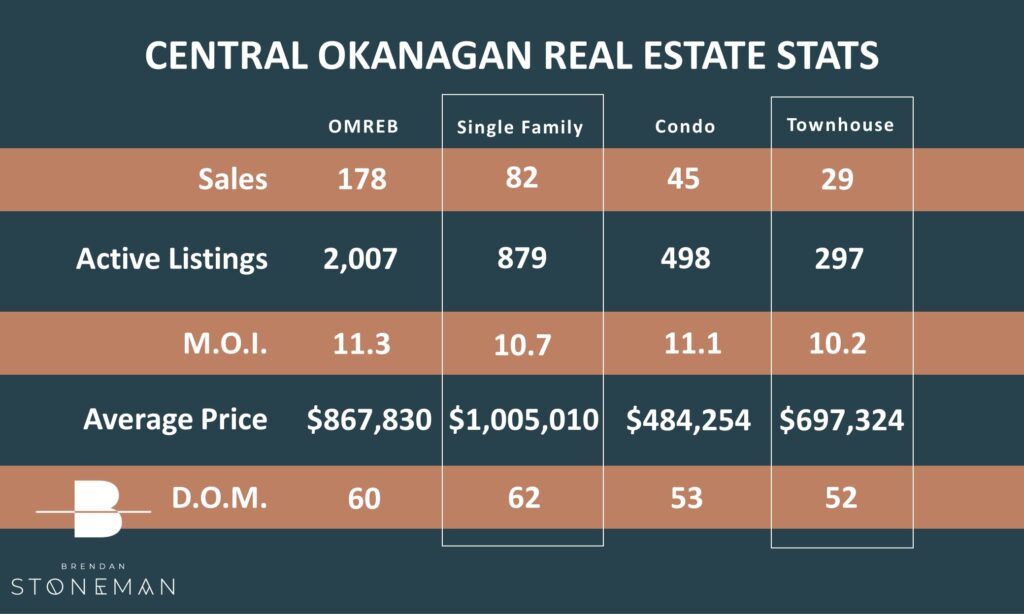
The table below shows the breakdown on where the 178 total monthly sales came from, and shows the total inventory levels for each property category.
On average, it is taking right around 60 days to sell a home, depending on the property type.
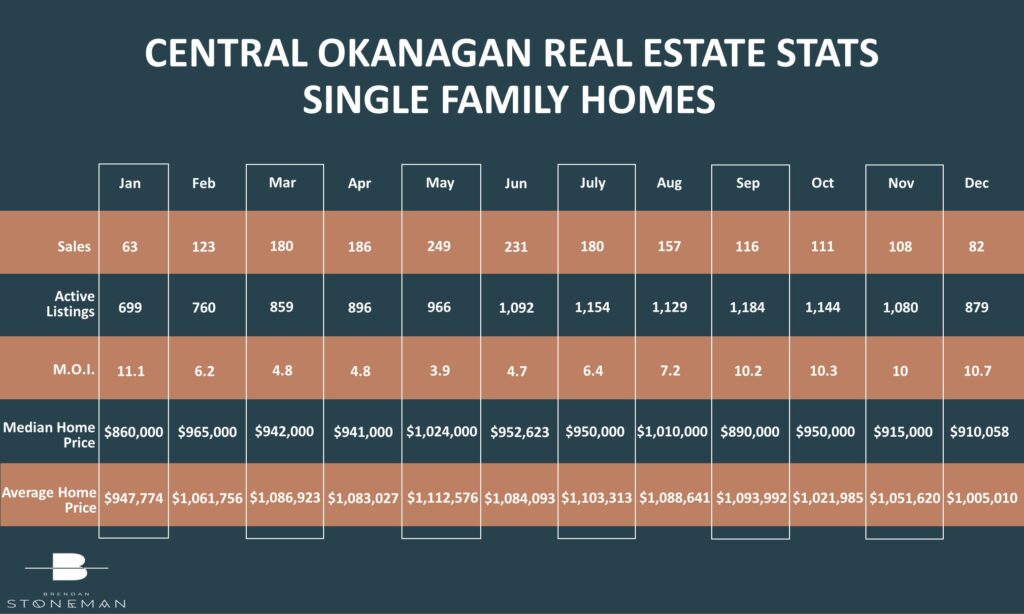
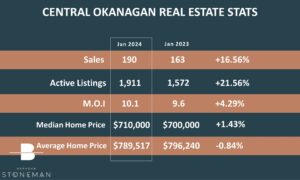
SINGLE FAMILY HOME MARKET UPDATE
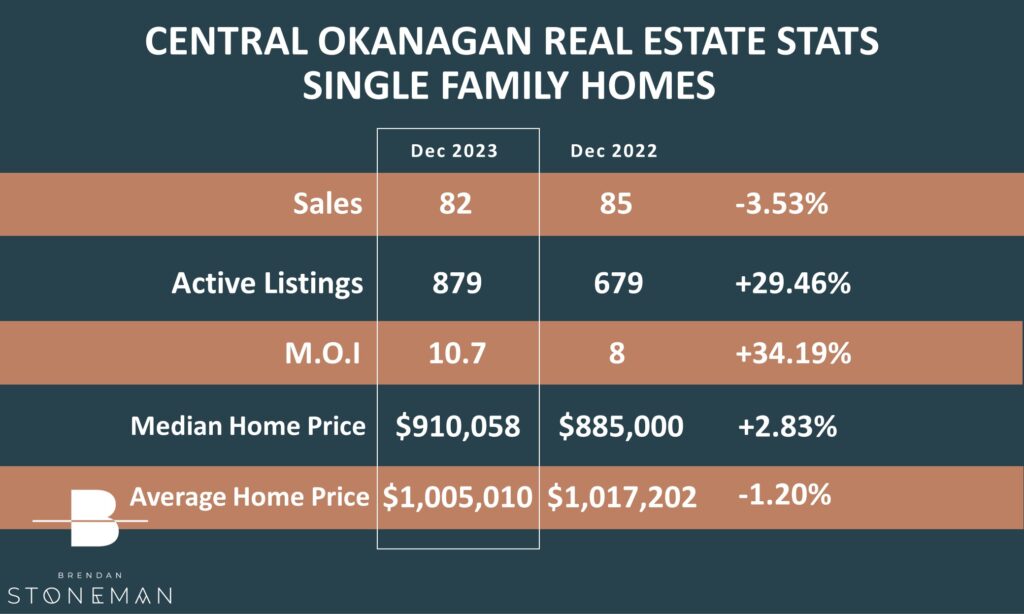
In the Single Family Home bracket we saw a sales decrease of 3% coupled with a 29% increase in inventory over December of last year.
The average price for the month remained above the Million Dollar mark, however pricing did take a small dip of about 1% below last Decembers average price.
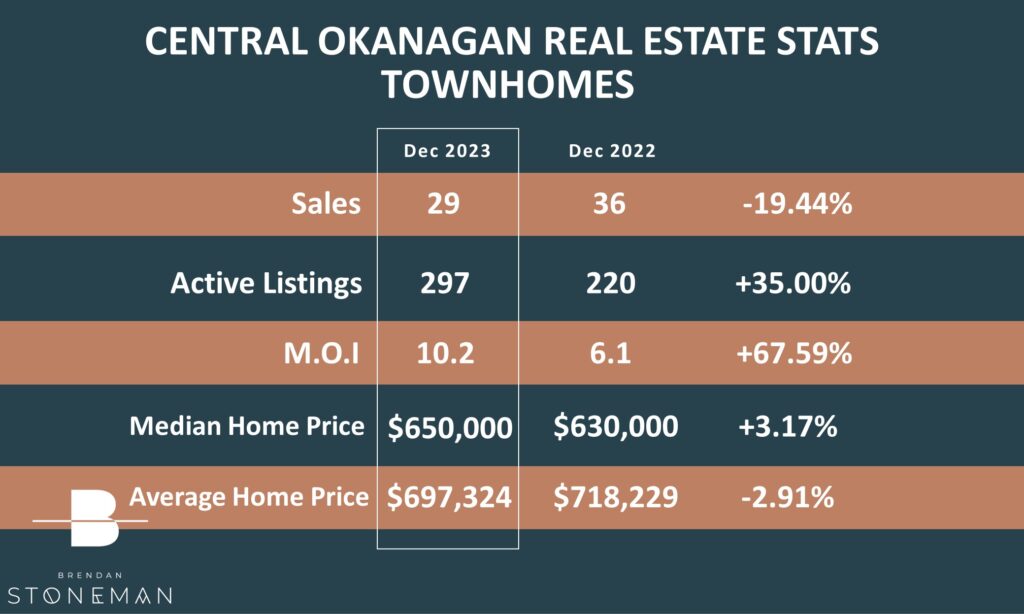
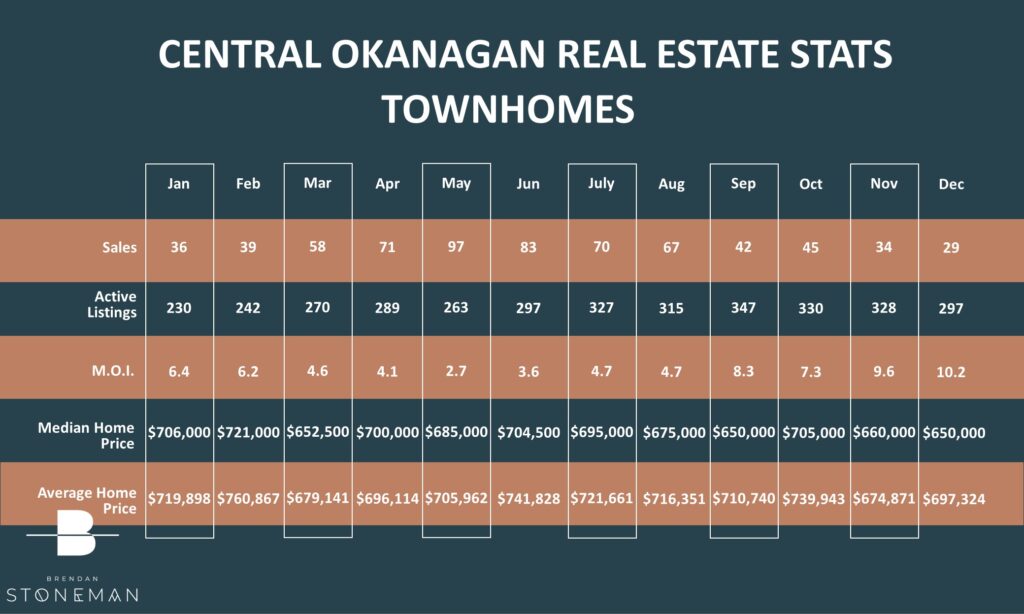
TOWNHOUSE MARKET UPDATE
The townhouse market has continued to remain in demand. Despite a 35% increase in inventory townhomes are still only making up less than 15% of all available listings. The average sale price finished at $697,324 – a decrease of almost 3% from the average of the same month last year.
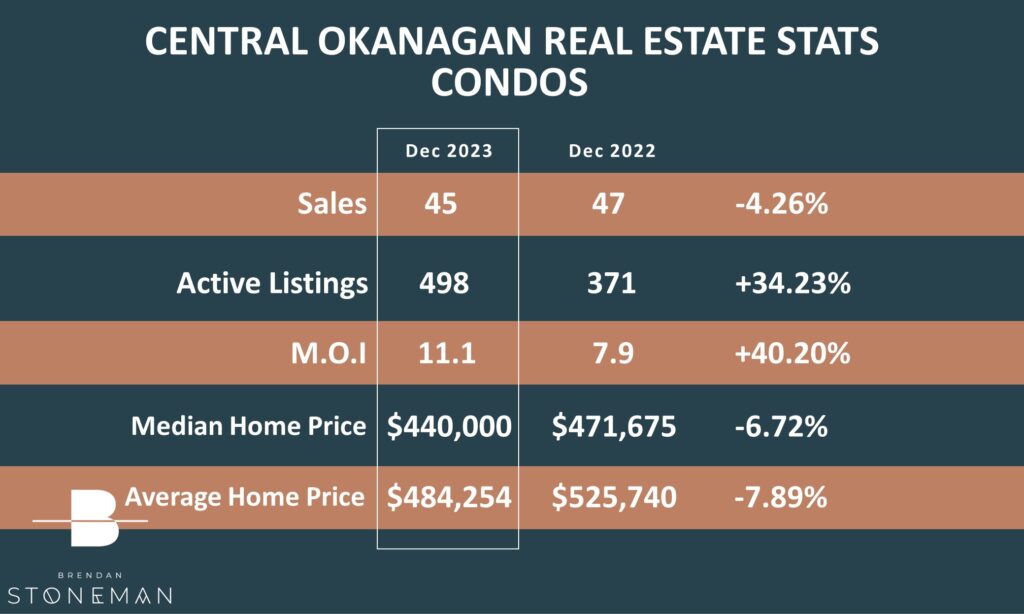
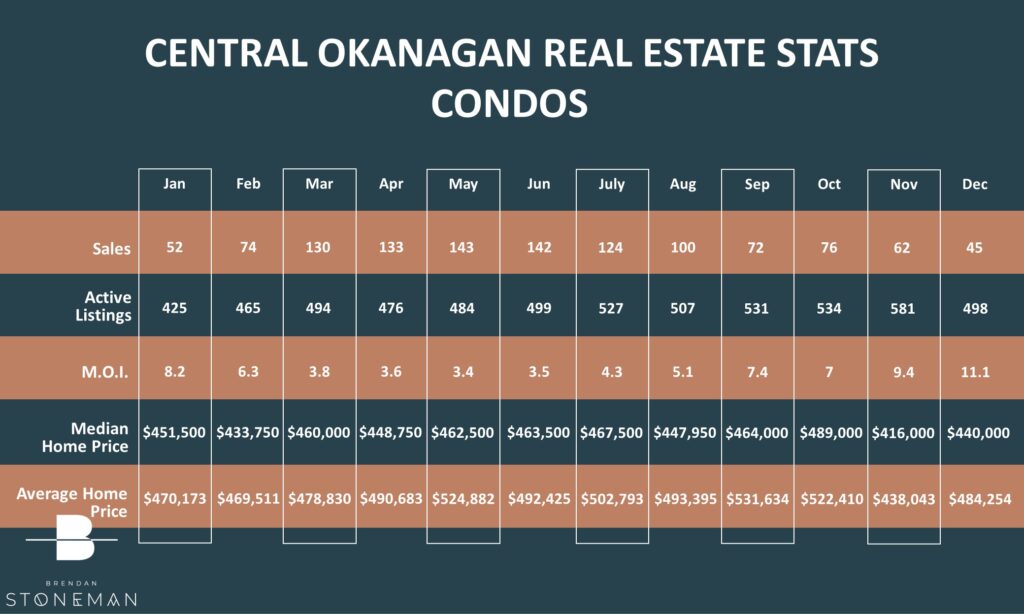
CONDO MARKET UPDATE
The condo market has also seen a dip in sales in comparison to this time last year. However, we do continue to see significant increases in inventory this year over last. The sales decreased by about 4% while the inventory increased by 34%.
SUPPLY & DEMAND
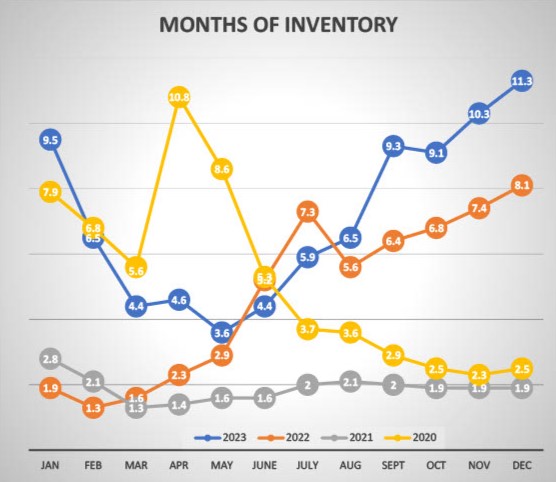
The months of inventory levels are our best way to determine the strength or weakness of the market…and to recap our benchmarks:
Less than 4 Months of Inventory is a Seller’s Market
4 to 6 Months of Inventory is a Balanced Market
More than 6 Months of Inventory is a Buyer’s Market
We’ve been tracking the Months of Inventory – the graph below outlines how the 12th month of 2023 went compared to the same time periods in the previous 3 years. In December of 2022 there were 8.1 months of inventory whereas this year we are seeing 11.3! This means we are continuing to sit in a strong buyers market at this time.
What does all this mean? Is now the time to make a move? I would love to discuss what may be right for you – Please feel free to reach out any time!

