

FEBRUARY 2024 – NEW YEAR ELEVATES SALES IN LOCAL MARKET
The first month of 2024 has brought an increase in sales to the Central Okanagan real estate market! This may signal that as we continue to move into the new year we could begin to see more competition in the buyers market than we did last year. Read on below for a full breakdown of what went on in our market this January.
In January 2024, we saw an increase of 16% in residential property sales over the previous year, while our total listing inventory increased by 21% to 1,911 listings in total. Currently, the overall average price (all residential property categories combined) is sitting nearly 1% below the average during the same time last year, landing at $789,517.
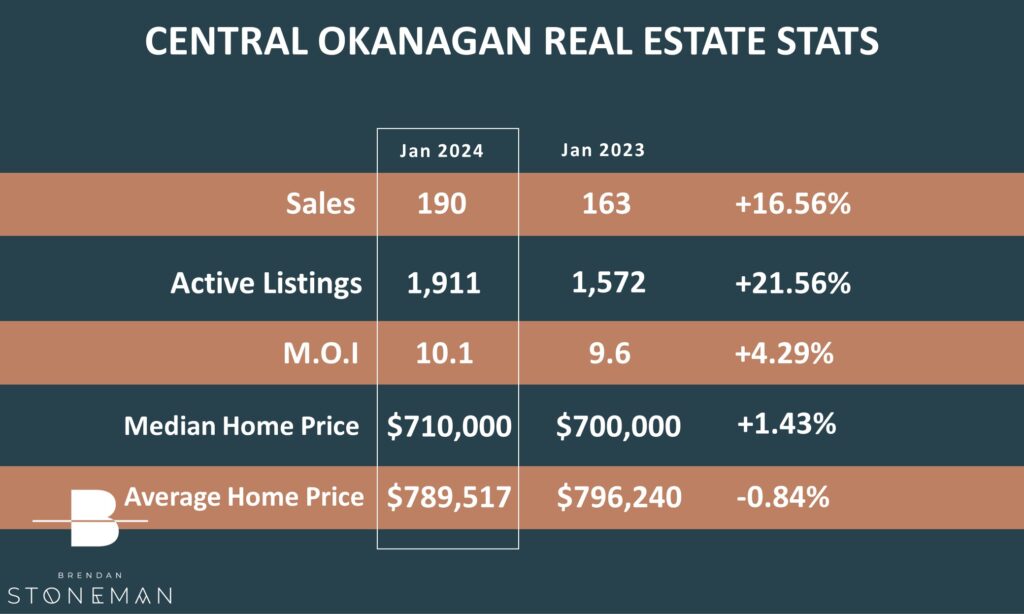
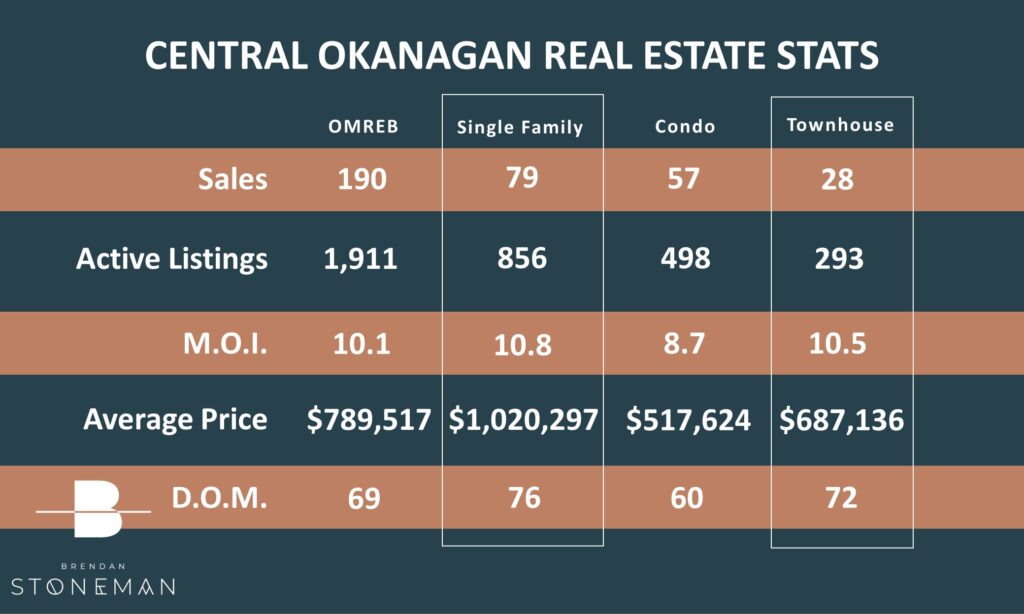
The table below shows the breakdown on where the 190 total monthly sales came from, and shows the total inventory levels for each property category.
On average, it is taking right around 69 days to sell a home, depending on the property type.
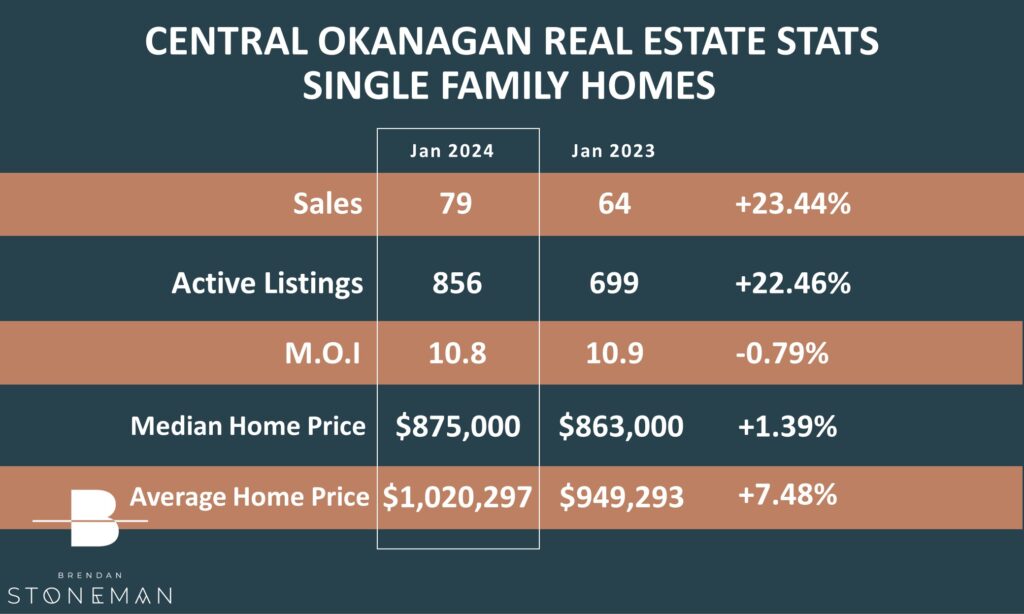
SINGLE FAMILY HOME MARKET UPDATE
In the Single Family Home bracket we saw a sales increase of 23% coupled with a 22% increase in inventory over January of last year.
The average price for the month remained above the Million Dollar mark, and also made a jump of 7% above last Januarys average price.
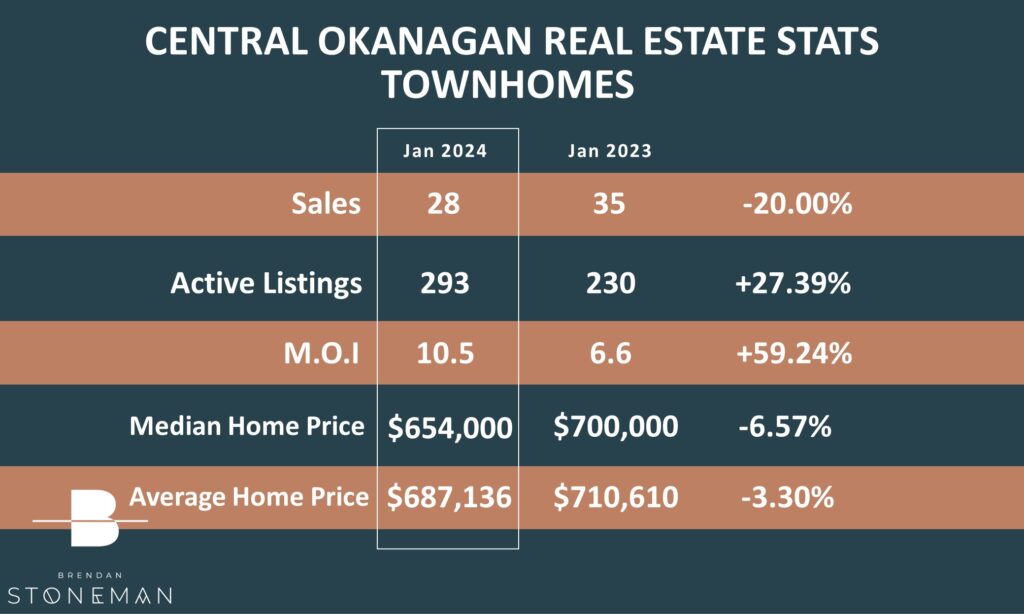
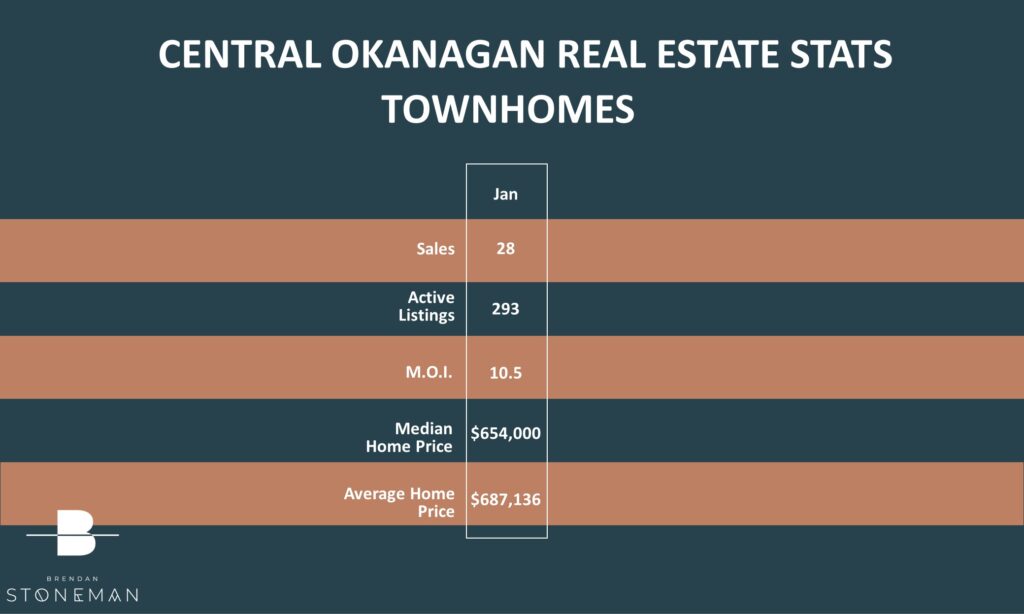
TOWNHOUSE MARKET UPDATE
The townhouse market is still in demand. Despite a 27% increase in inventory townhomes are still only making up 15% of all available listings. The average sale price finished at $687,136 – a decrease of 3% from the average of the same month last year.
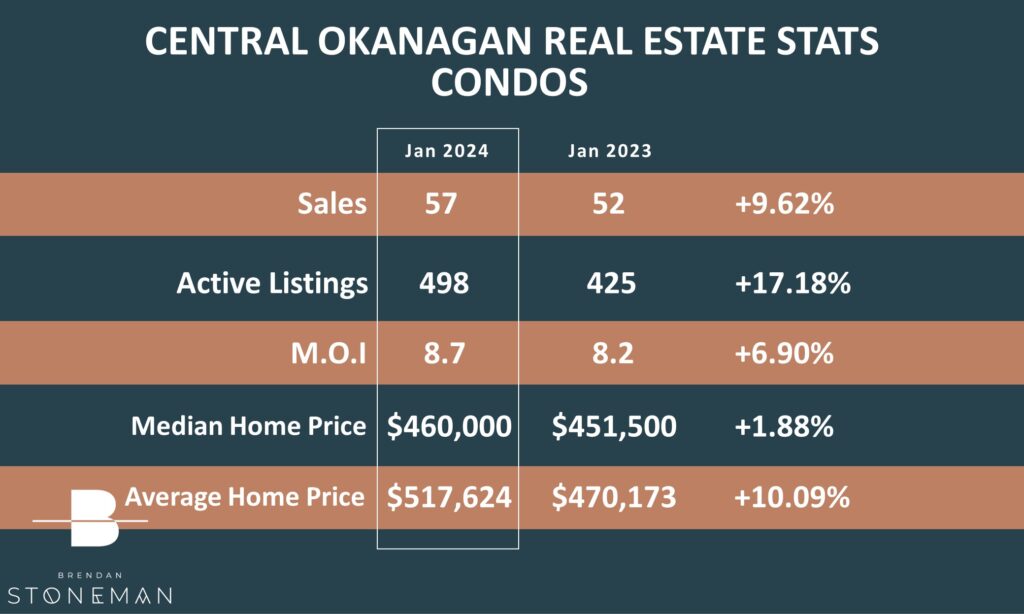
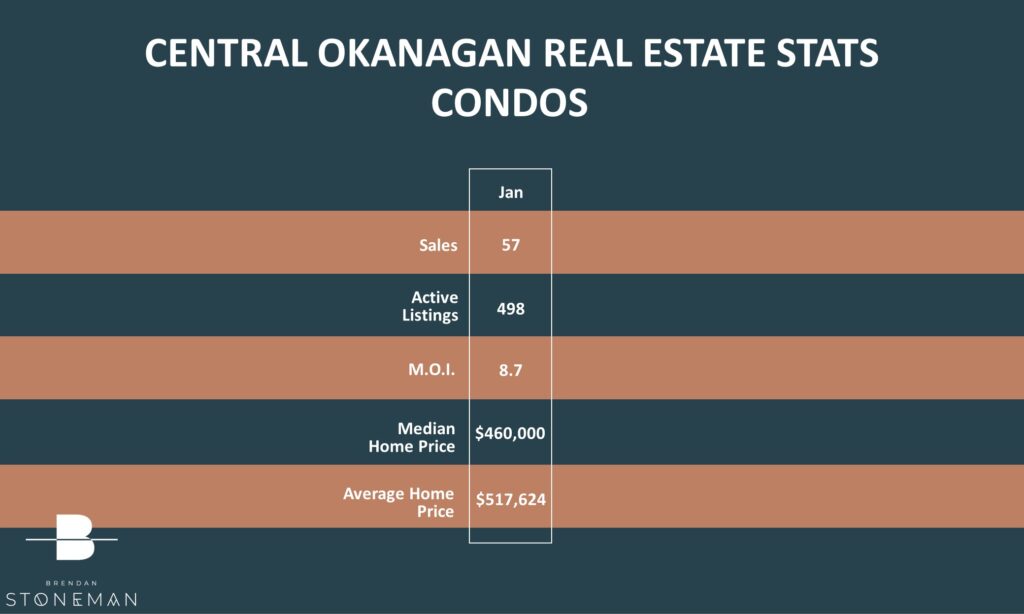
CONDO MARKET UPDATE
The condo market has seen a rise in sales in comparison to this time last year. We also continue to see significant increases in inventory this year over last. The sales increased by about 9% while the inventory increased by 17%.
SUPPLY & DEMAND
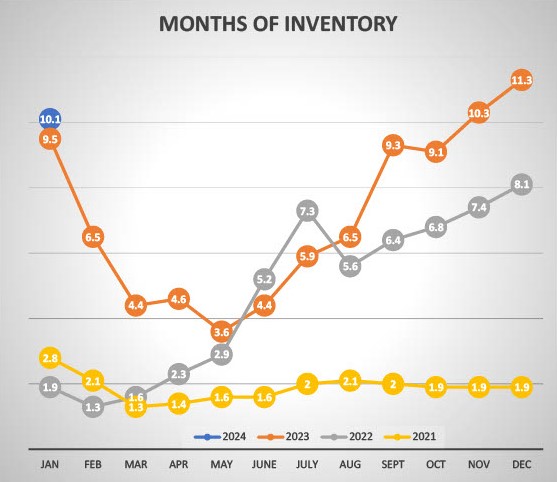
The months of inventory levels are our best way to determine the strength or weakness of the market…and to recap our benchmarks:
Less than 4 Months of Inventory is a Seller’s Market
4 to 6 Months of Inventory is a Balanced Market
More than 6 Months of Inventory is a Buyer’s Market
We’ve been tracking the Months of Inventory – the graph below outlines how the 1st month of 2024 went compared to the same time periods in the previous 3 years. In January of 2023 there were 9.5 months of inventory whereas this year we are seeing 10.1. This means we are continuing to sit in a strong buyers market at this time.
What does all this mean? Is now the time to make a move? I would love to discuss what may be right for you – Please feel free to reach out any time!

