

MAY 2022 – THE MARKET: INCHING TOWARD BALANCED CONDITIONS?
In April 2022, we saw a nearly 34% decrease in residential property sales over the previous year, while our total listing inventory increased by 12% to 1,334 listings in total. Average and median prices have seen a small price drop since last month – however, the overall average price (all residential property categories combined) is still sitting 21% above the same time last year, landing at $930,207. At this time we are still sitting in a sellers market with low inventory levels.
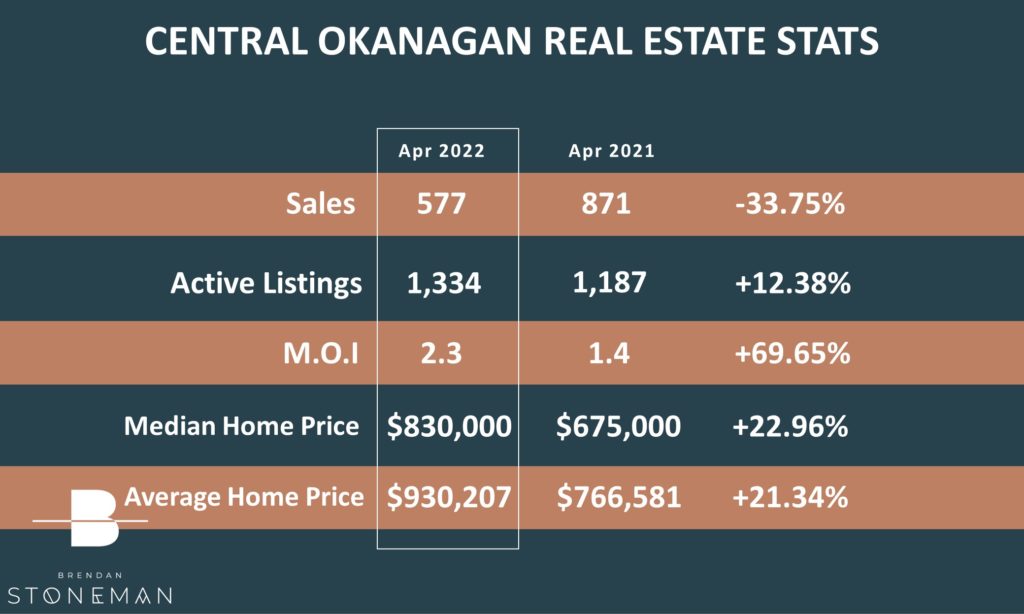
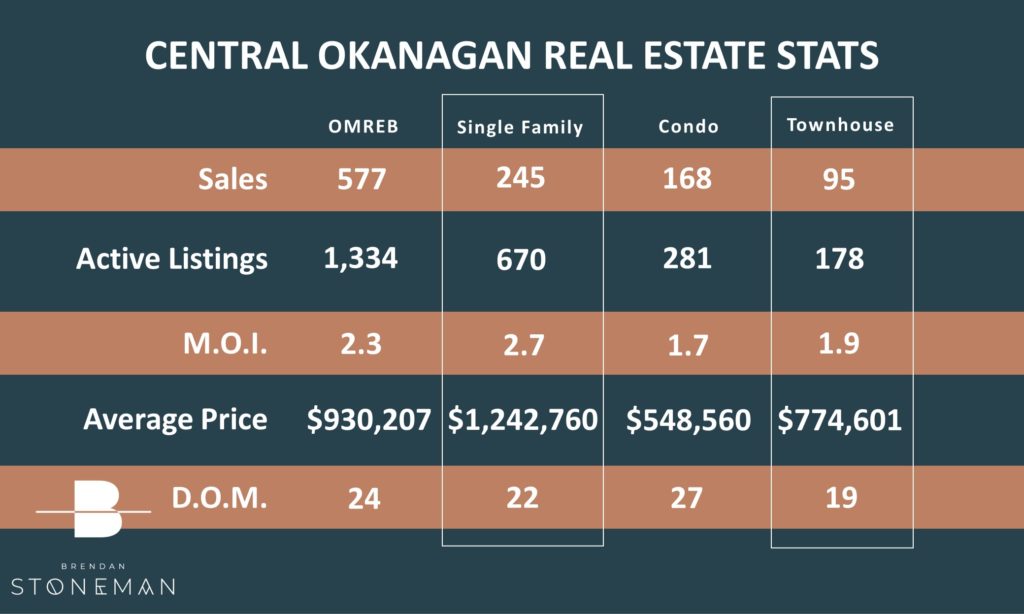
The table below shows the breakdown on where the 577 total monthly sales came from, and shows the total inventory levels for each property category.
On average, it is taking right around 24 days to sell a home, depending on the property type.
SINGLE FAMILY HOME MARKET UPDATE
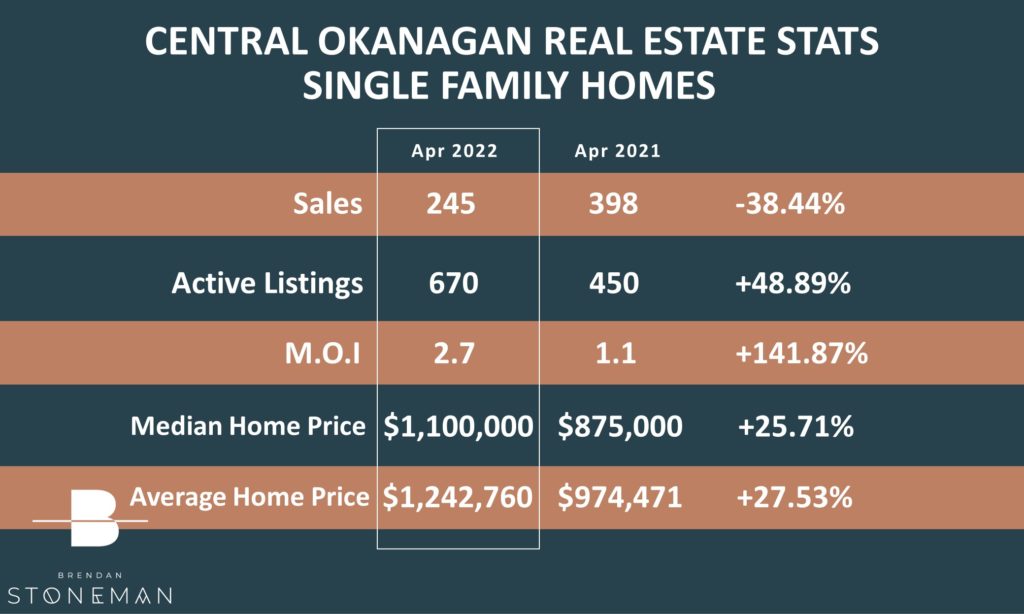
In the Single Family Home bracket we saw a sales decrease of 38% coupled with a nearly 49% increase in inventory over April of last year. Although sales decreased and the inventory selection has expanded, we are still in a seller’s market at this time.
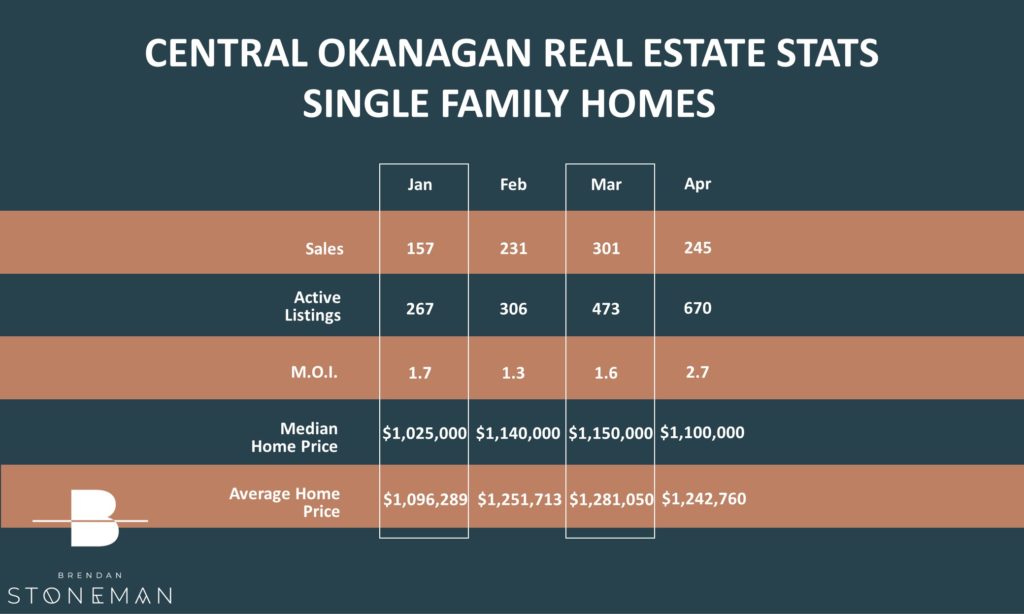
The average price for a Single Family Home in April remained above the Million Dollar mark, however for the for the first time in nearly a year we saw a price decrease in this category, bringing the average price down to $1,242,760!
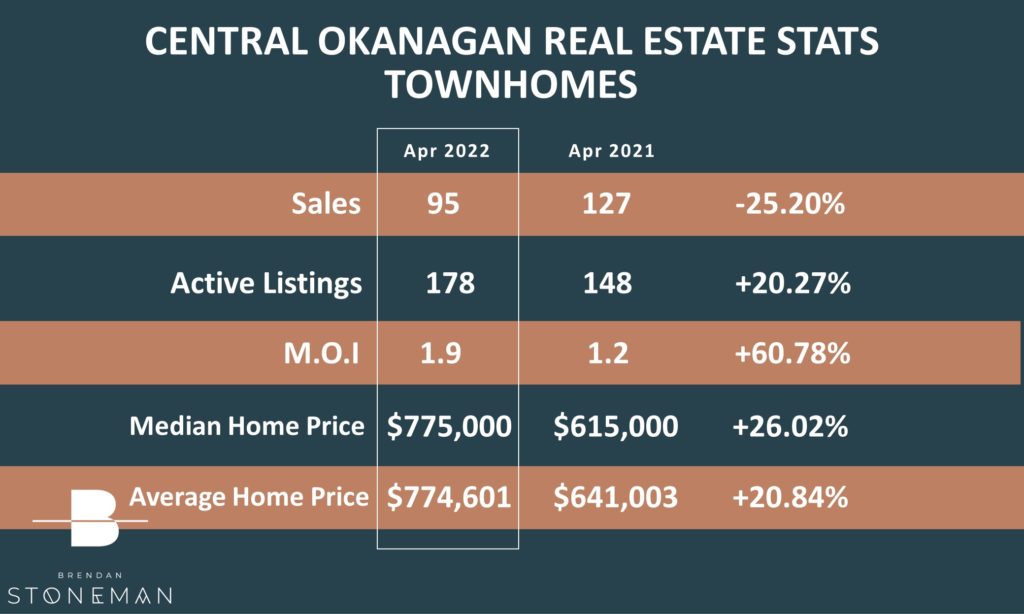
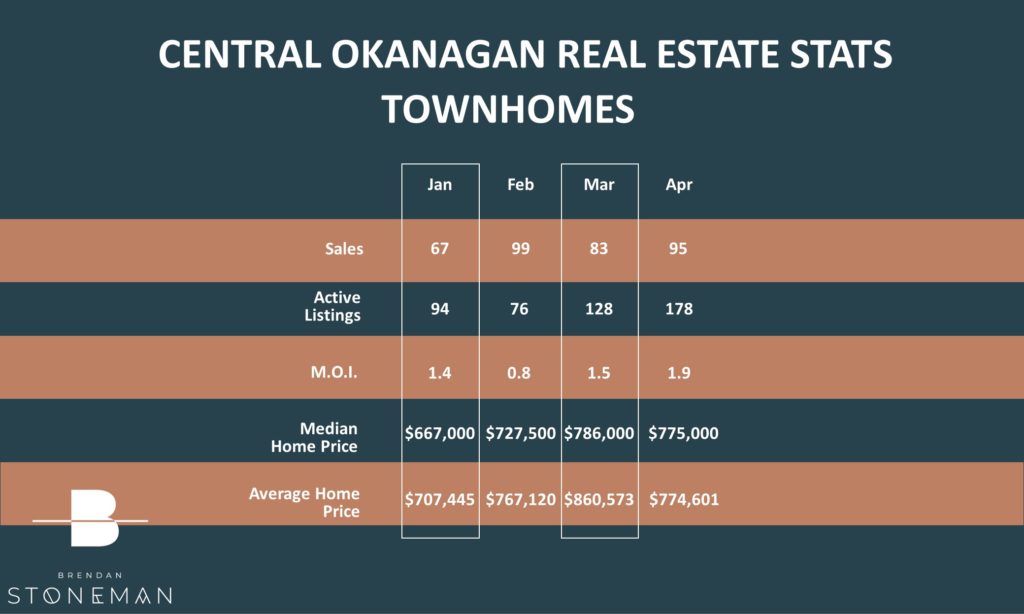
TOWNHOUSE MARKET UPDATE
The townhouse market is also still going strong. A 20% increase in inventory has left townhomes making up 13% of all available listings. The average sale price finished at $774,601 – an increase of about 21% over the average from the same month last year.
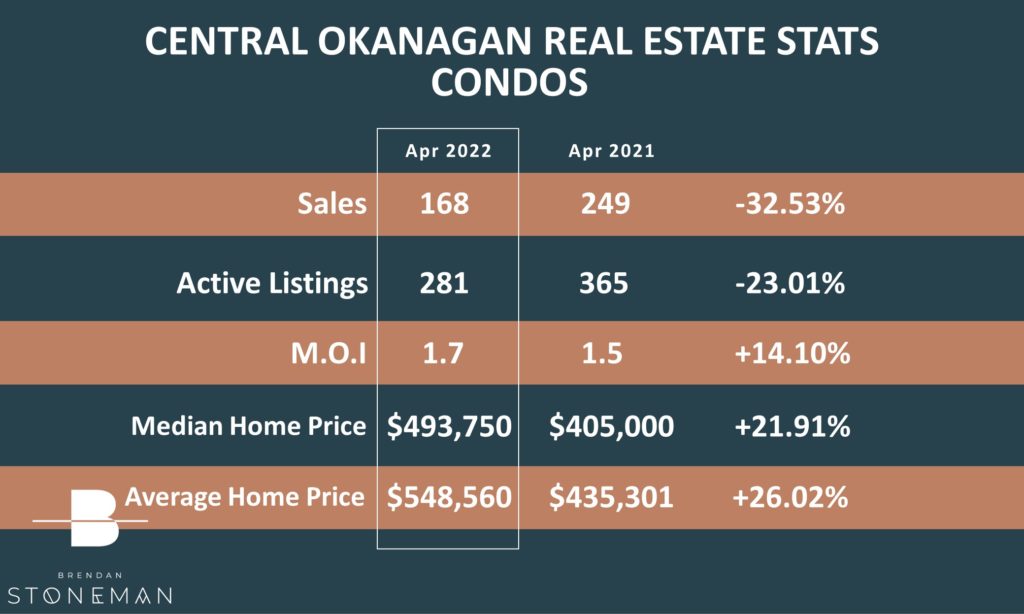
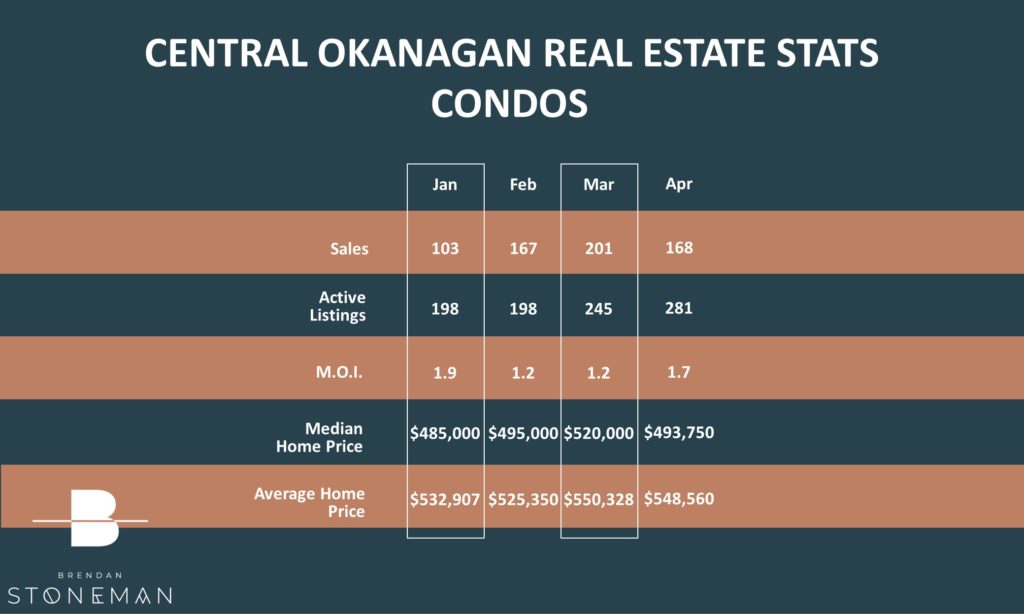
CONDO MARKET UPDATE
The condo market has seen a decrease in sales in comparison to this time last year. Unlike the other home categories, we continue to see large decreases in inventory this year over last. The sales decreased by 32% while the inventory decreased by 23%!
SUPPLY & DEMAND
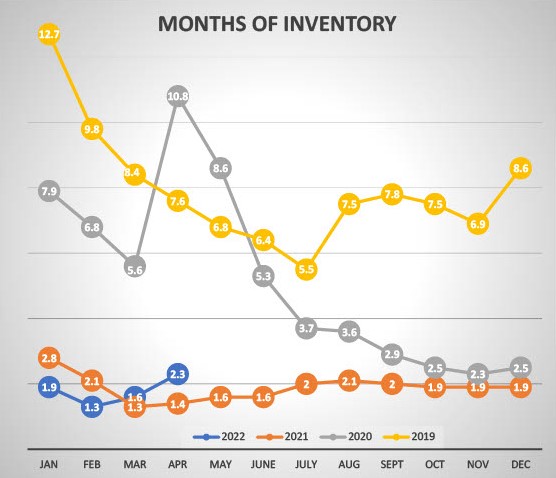
The months of inventory levels are our best way to determine the strength or weakness of the market…and to recap our benchmarks:
Less than 4 Months of Inventory is a Seller’s Market
4 to 6 Months of Inventory is a Balanced Market
More than 6 Months of Inventory is a Buyer’s Market
We’ve been tracking the Months of Inventory – the graph below outlines how the fourth month of 2022 went compared to the same time periods in the previous 3 years. You will see a difference here – in 2021 there were 1.4 months of inventory whereas this year we are seeing 2.3! This means if no new properties were listed, in 10 weeks, every home in Kelowna would be sold!
What does all this mean? Is now the time to make a move? I would love to discuss what may be right for you – Please feel free to reach out any time!

