

MAY 2023 – SPRING BRINGS INCREASED MARKET ACTIVITY
Spring is known as one of the busiest times in the real estate market, and this season is no different. We have been seeing a renewed interest in buyers, and even instances of multiple offers on some listings!
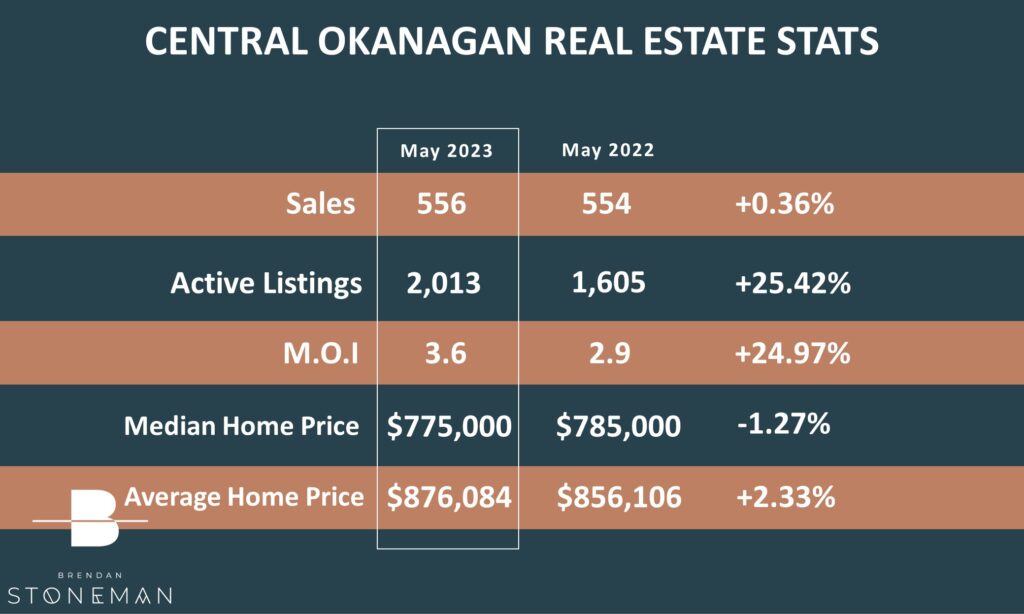
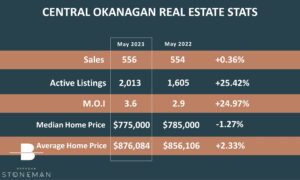
In April 2023, we saw only a 26% decrease in residential property sales over the previous year, while our total listing inventory increased by over 45% to 1,946 listings in total. The overall average price (all residential property categories combined) is sitting nearly 14% below the average during the same time last year, landing at $796,91.
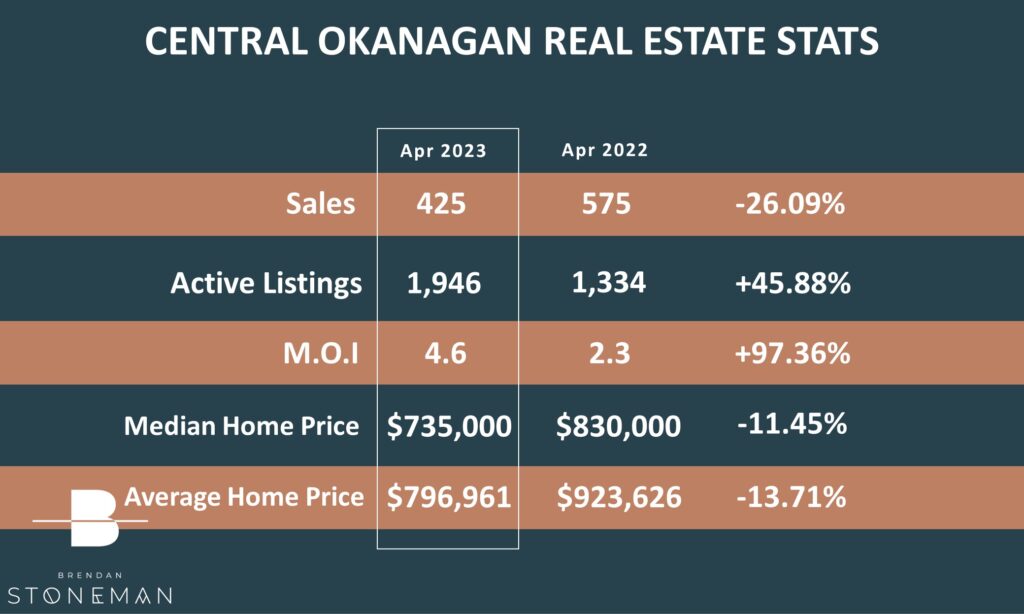
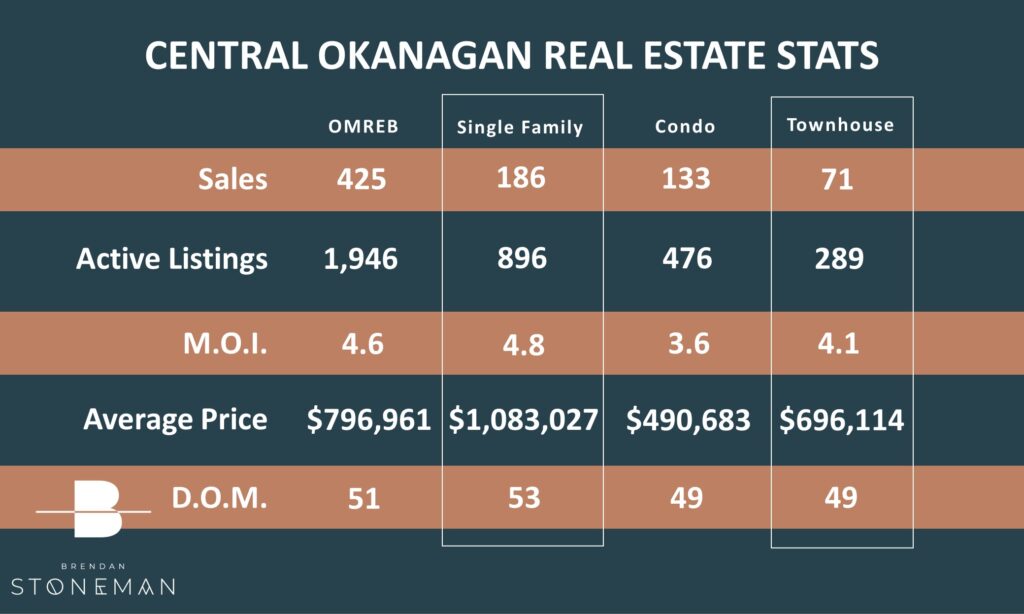
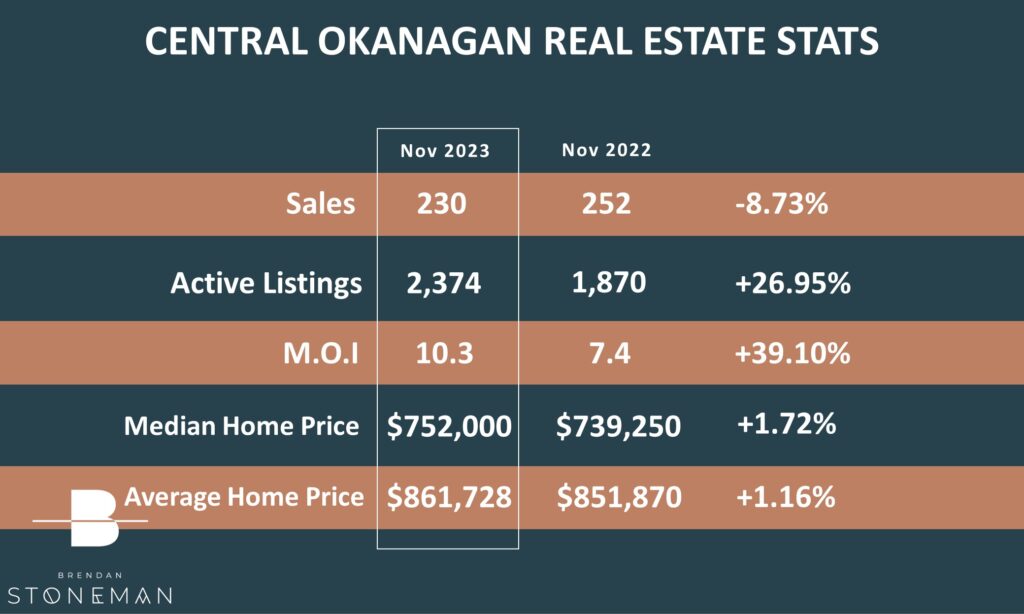
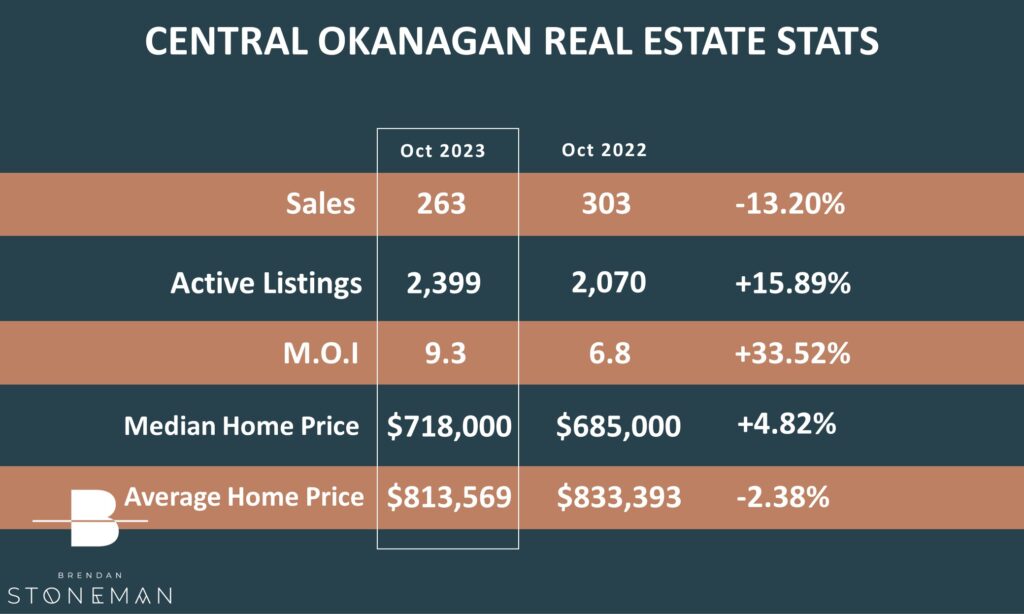
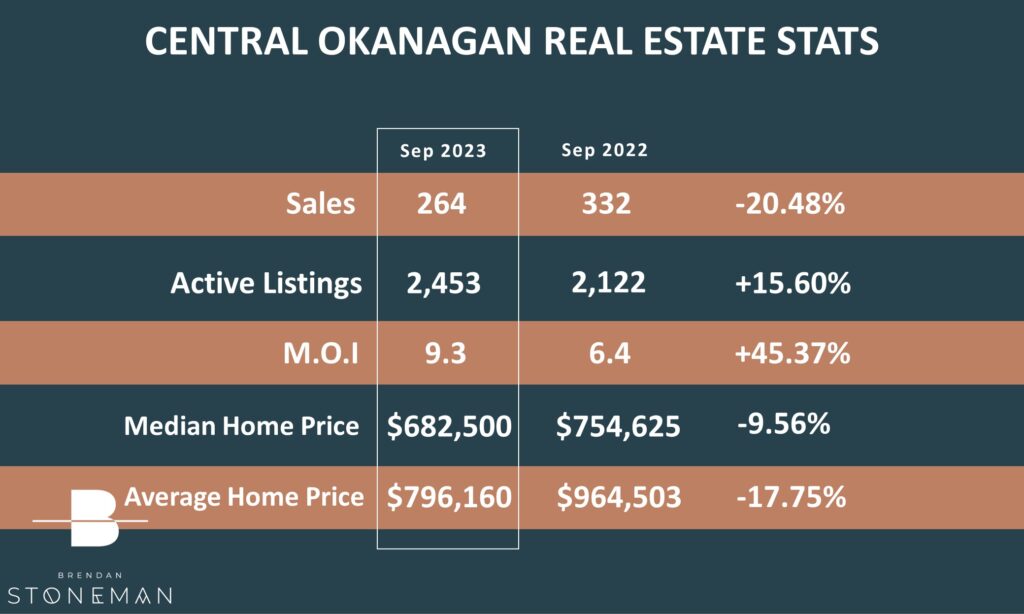
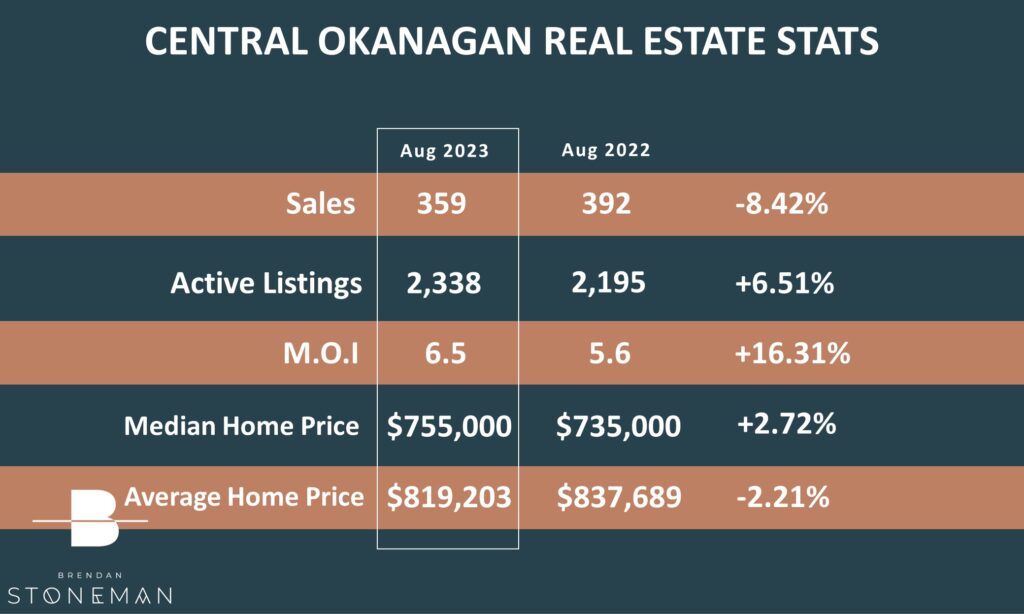
The table below shows the breakdown on where the 425 total monthly sales came from, and shows the total inventory levels for each property category.
On average, it is taking right around 51 days to sell a home, depending on the property type.
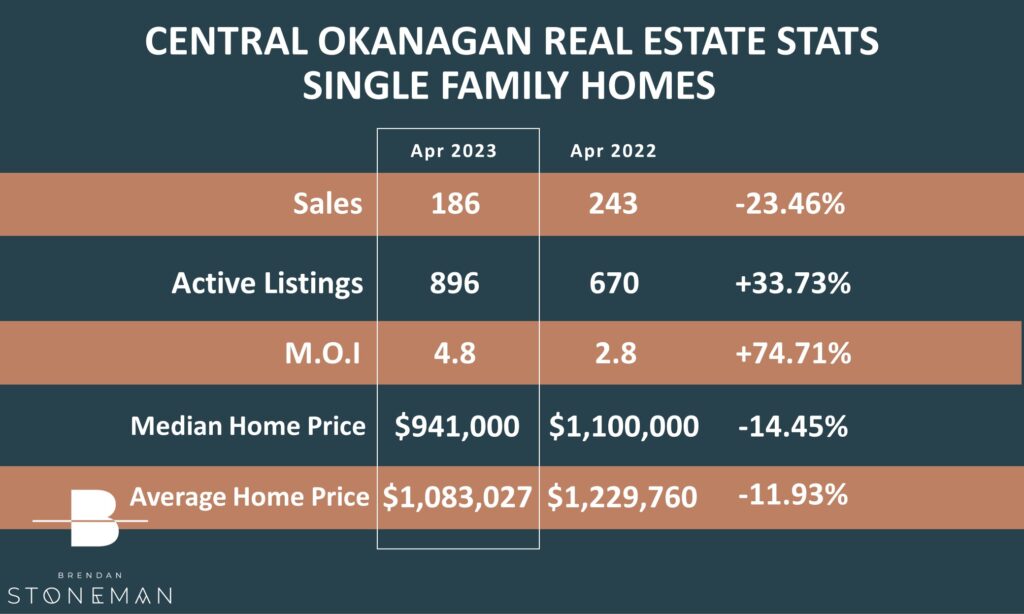
SINGLE FAMILY HOME MARKET UPDATE
In the Single Family Home bracket we saw a sales decrease of 23% coupled with a 33% increase in inventory over April of last year.
The average price for the month remained above the Million Dollar mark, while still coming in nearly 12% under last April’s average price.
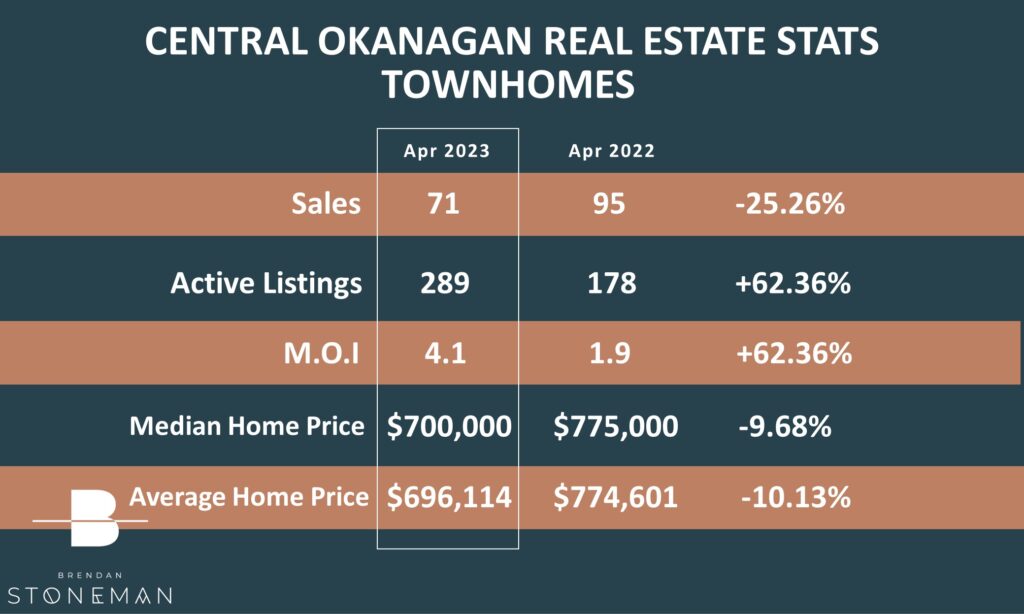
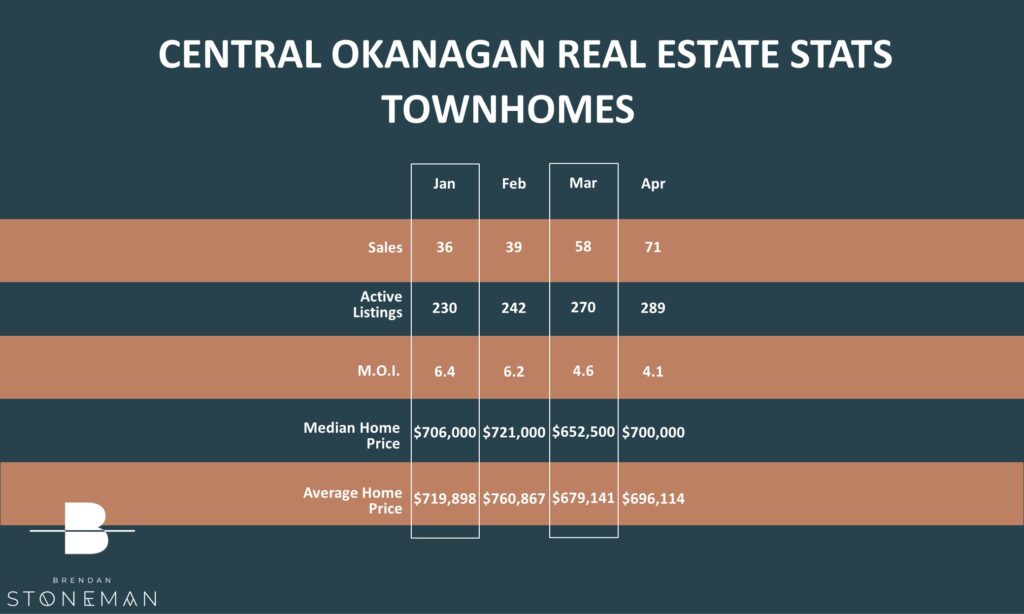
TOWNHOUSE MARKET UPDATE
The townhouse market is still in high demand. Despite a 62% increase in inventory townhomes have continued to make up less than 15% of all available listings. The average sale price finished at $696,114 – a 10% decrease from the average of the same month last year.
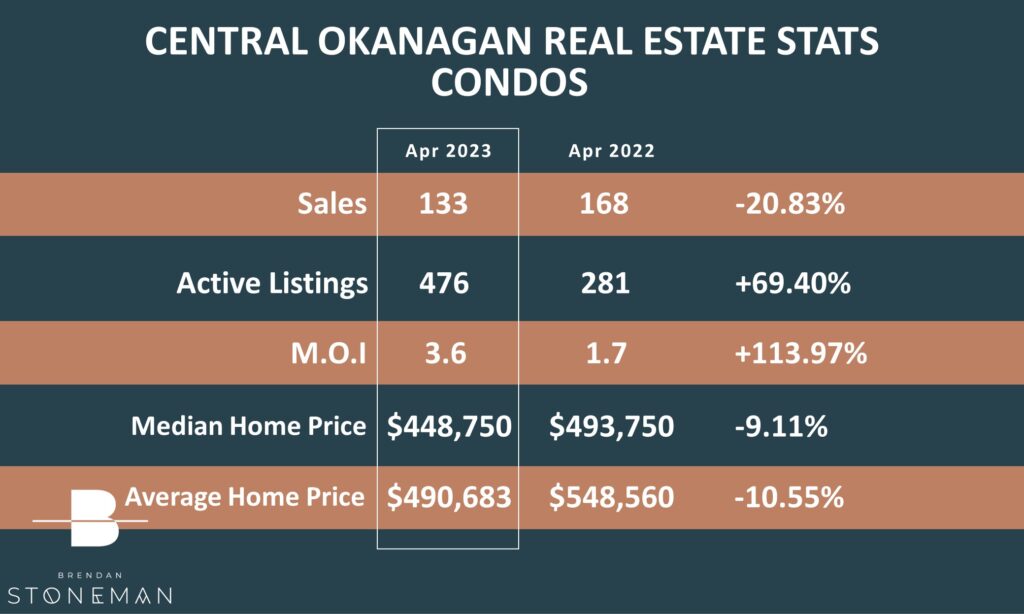
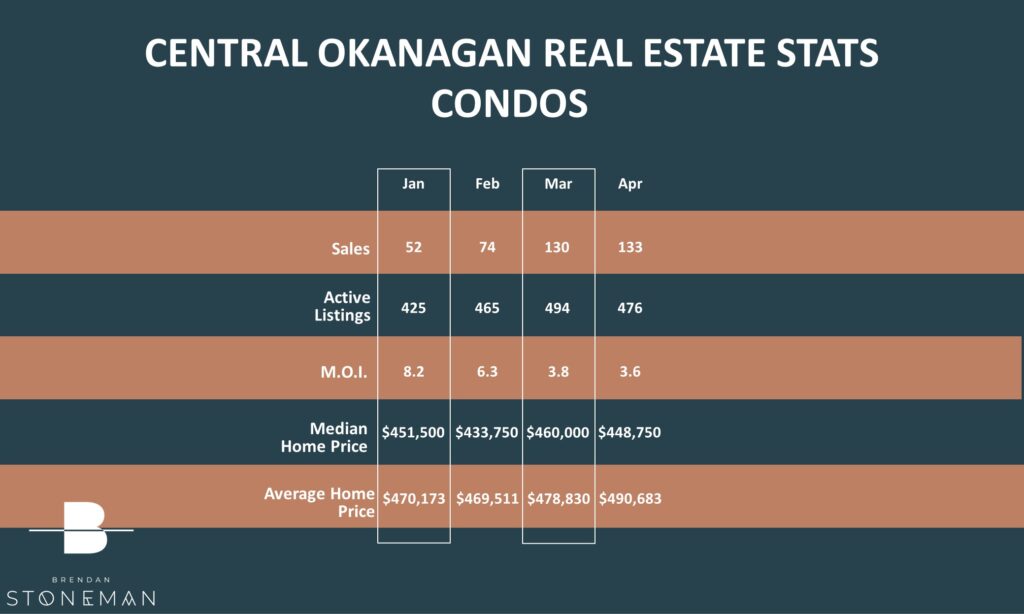
CONDO MARKET UPDATE
The condo market has also seen a decrease in sales in comparison to this time last year. Like the other home categories, we continue to see increases in inventory this year over last. The sales decreased by 20% while the inventory increased by 69%.
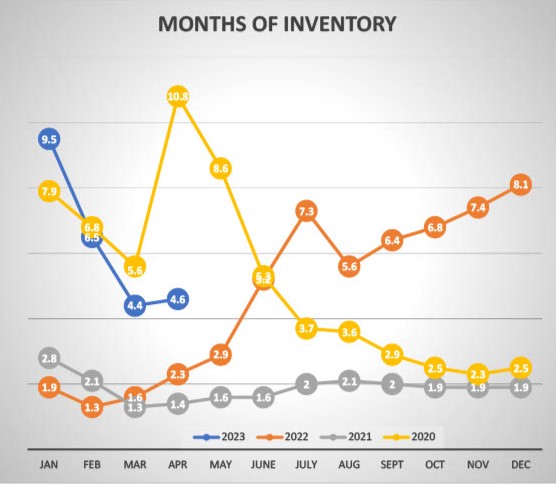
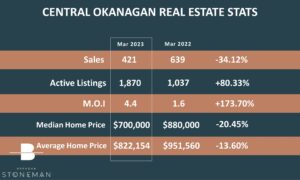
SUPPLY & DEMAND
The months of inventory levels are our best way to determine the strength or weakness of the market…and to recap our benchmarks:
Less than 4 Months of Inventory is a Seller’s Market
4 to 6 Months of Inventory is a Balanced Market
More than 6 Months of Inventory is a Buyer’s Market
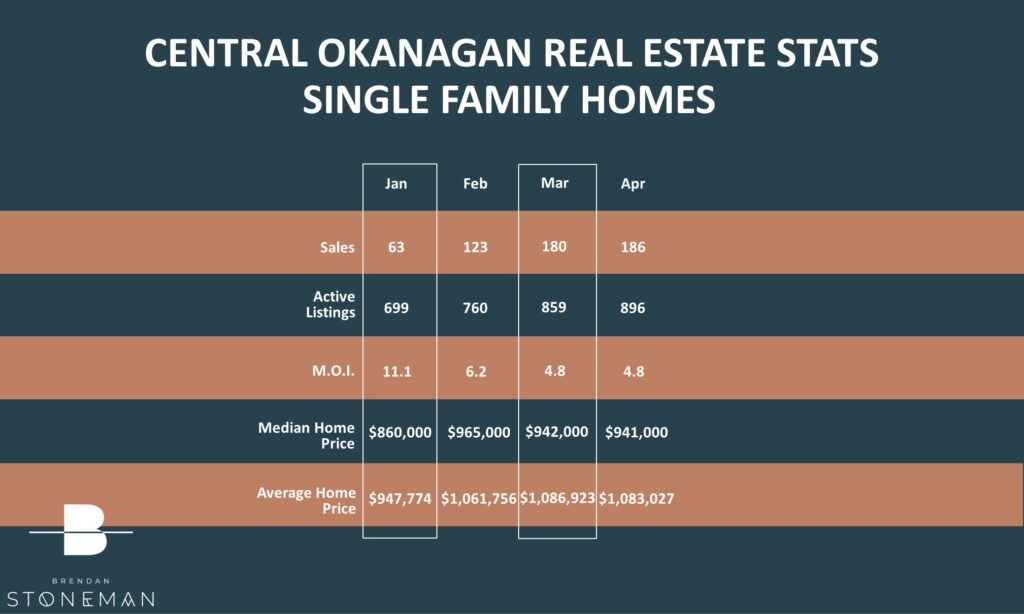
We’ve been tracking the Months of Inventory – the graph below outlines how the 4th month of 2023 went compared to the same time periods in the previous 3 years. You will see a big difference here – in April of 2022 there were only 2.3 months of inventory whereas this year we are seeing 4.6! This means we are working in the territory of a more balanced housing market at this time.
What does all this mean? Is now the time to make a move? I would love to discuss what may be right for you – Please feel free to reach out any time!

